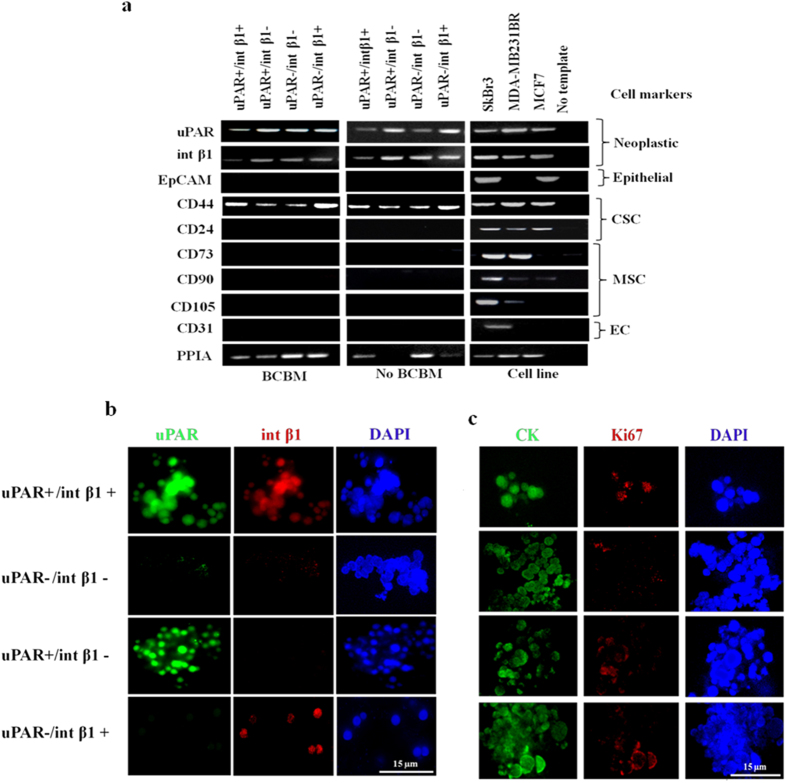
Figure 4. Biomarker profiling of uPAR/int β1 in 3D CTC tumorspheres.
(a) EpCAM-negative/CD45−/CD44+/CD24− and uPAR/int β1 CTC subsets were cultured as 3D CTC tumorspheres. mRNAs were amplified by REPLI-g WTA single-cell kit (Qiagen) followed by RT-PCR analyses. Polypropyl isomerase (PPIA) was used as internal loading control. MCF7, MDA-MB-231Br and SKBr3 cell lines were used as additional positive/negative controls. CSC, Cancer Stem-Cell; MSC, Mesenchymal Stem-Cell; EC, Endothelial Circulating Cell; BCBM, Breast Cancer Brain Metastasis. All other data are representation of at least triplicate independent experiments. Full-size gel images are incorporated in Supplementary figure 3; (b,c) Immunofluorescence staining was done for combinatorial expression of (b) uPAR and int β1 (c) pan-cytokeratin and Ki67 markers. Deconvulated cell imaging and projection were done by DeltaVision Deconvolution Microscope (GE Healthcare Life Sciences, Inc.), and analyzed by SoftWoRx software version 6.1.3 (GE Healthcare Life Sciences, Inc.) at 100X. Scale bars, 15 μM. Brightness and contrast of images were adjusted for publication purposes. Representative images are shown.

