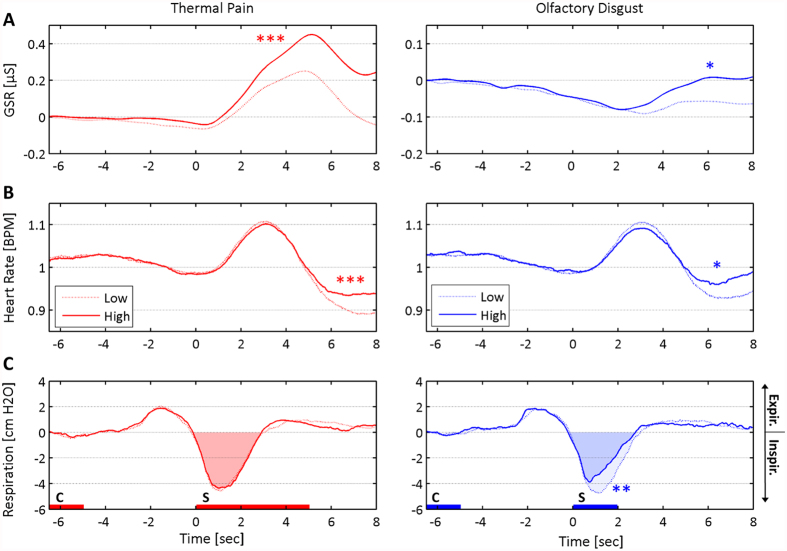
Figure 4. Event-related physiological responses during the reference trials (cue fully consistent with stimulation).
(A) Skin conductance response (B) heart rate, and (C) respiration averaged across 18 subjects. Data for thermal stimulation in the left column, olfactory stimulation in the right column. The horizontal axis reflects time in each trial, with 0 referring to the stimulation onset (marked as S) and cue presentation occurring 6.5 sec before (marked as (C). For respiration, the area under the inspiration curve (AUC) is also highlighted, consistently with the analysis described in the methods section. Differential responses between stimuli with high and low unpleasantness are highlighted consistently with the analysis reported in the Results section: ***for differences at p < 0.001; **p < 0.01; *p < 0.05. “Expir.” refers to expiration, whereas “Inspir.” refers to inspiration.

