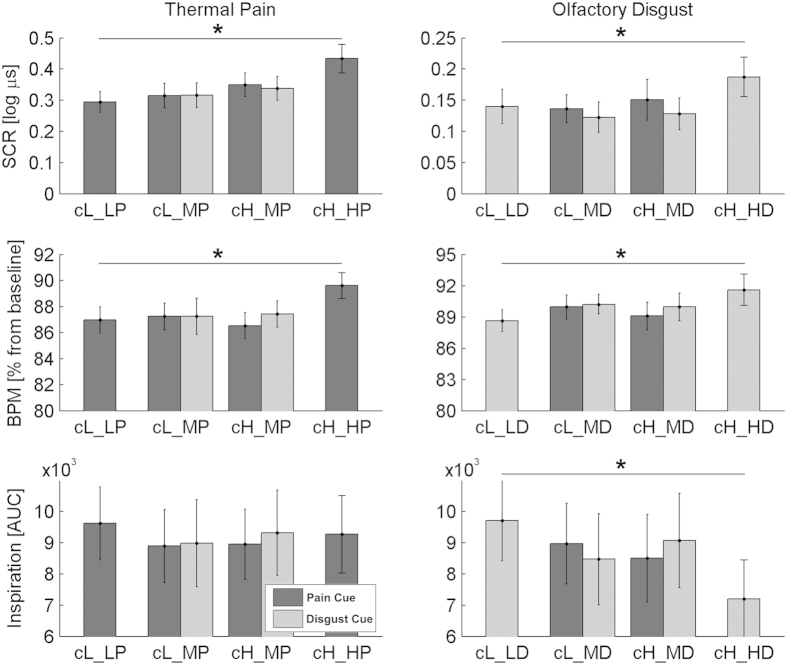
Figure 5. Average Skin Conductance Response (SCR), Heart Rate (HR), and inspiration volume (AUC) associated with the stimulation periods.
Error bars represent standard errors of the mean. Axis and bar codes are similar to those in Fig. 2. *refer to conditions eliciting differential autonomic responses in the reference trials (full details in the text).

