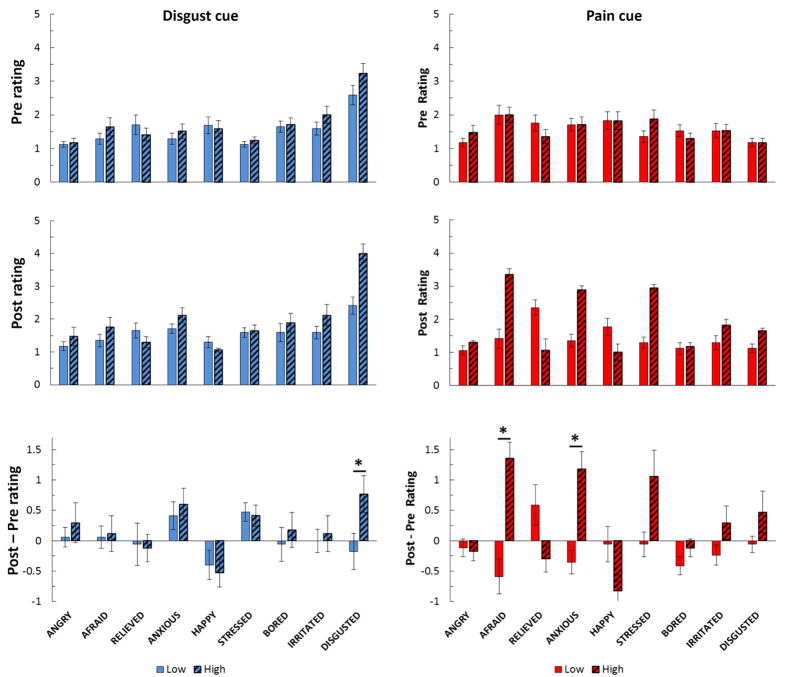
Figure 6. Emotional response to the different types of cue collected before (top row) and after the experimental session (middle row).
Additionally, differential value (post-pre) are also displayed in the bottom row. For each row, rating values (averaged across 18 subjects) are plotted along 9 distinct emotional categories (anger, fear, relief, anxiety, happiness, stress, boredom, irritation, and disgust), on a scale from 1 (not at all) to 5 (absolutely). Ratings of pain (left column) and disgust (right column) cues are displayed in separate subplots and different colours. *refer to significant differences between cue of high vs. low unpleasantness in each modality. Error bars refer to standard errors of the mean.

