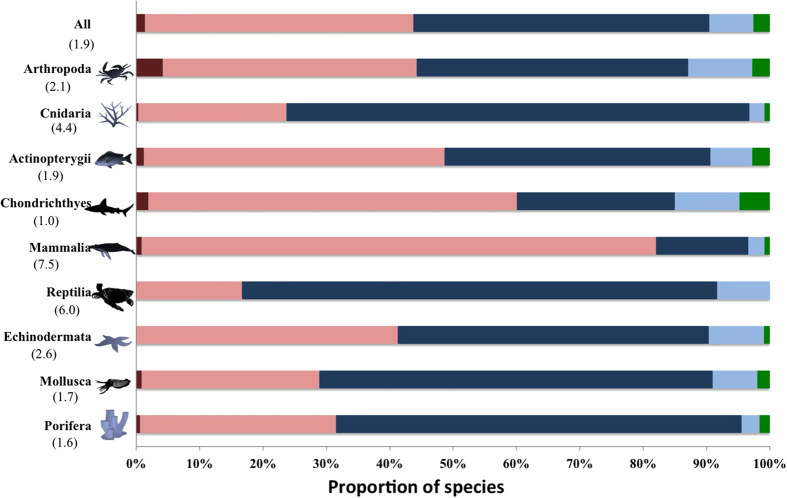
Figure 1. Percentage of marine species with 0% (dark red), 0–2% (pink), 2–5% (dark blue), 5–10% (light blue), and >10% (green) of their range overlapping with marine protected areas (IUCN I-IV).
Data are shown for all species (top) and species in the 6 largest phyla (n = 16181), where the largest phyla (Chordata) is split into its 4 largest classes (Actinopterygii, Chondrichthyes, Mammalia, Reptilia). Median range size (million km2) of species in each group is shown in brackets. Created by CJK using Microsoft Excel and Powerpoint Software. Tracey Saxby, Integration and Application Network, University of Maryland Center for Environmental Science (ian.umces.edu/imagelibrary/).

