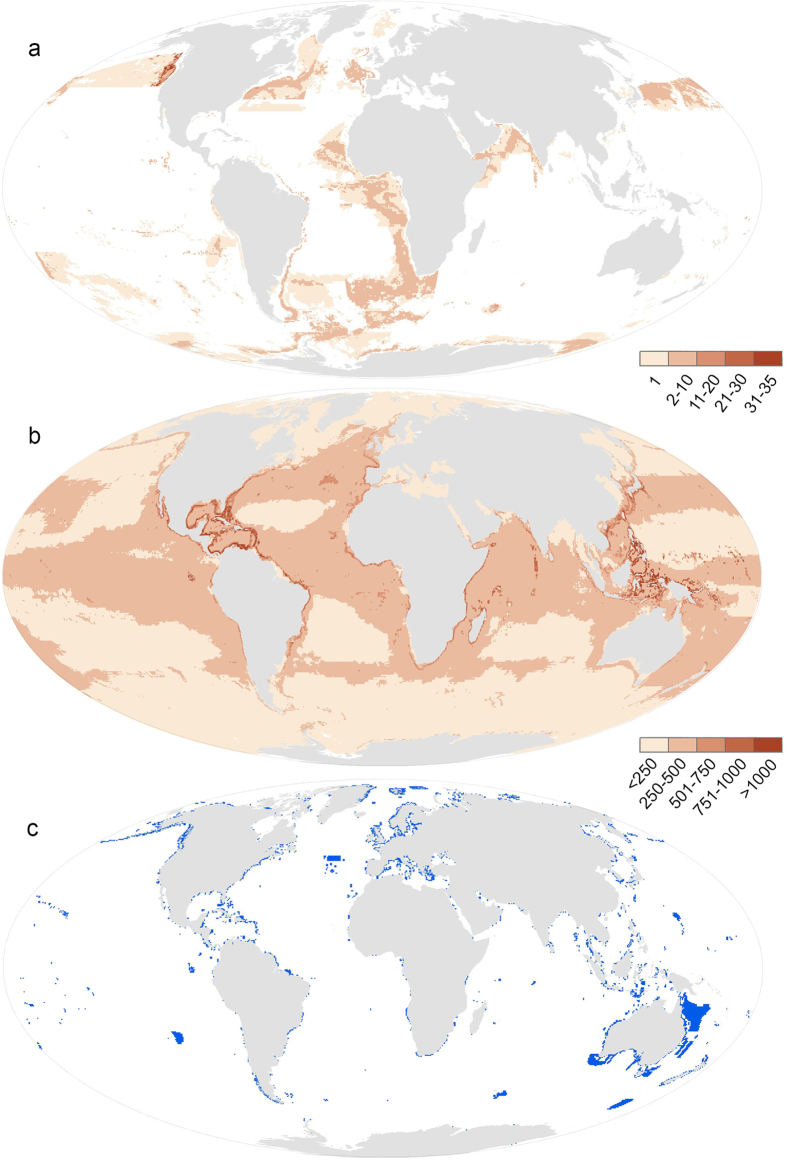
Figure 2.
Density map of gap species (a) and very low coverage species (<2% of range represented) (b) per half-degree cell, created by overlaying the ranges of all species in these groups. Marine protected areas classified as IUCN I-IV that spatially overlapwith any marine area are shown in blue (c). Density maps using other marine protected area classifications are shown in Figures S1 and S2. Created by JM using ESRI ArcGIS Software.

