Figure 4.

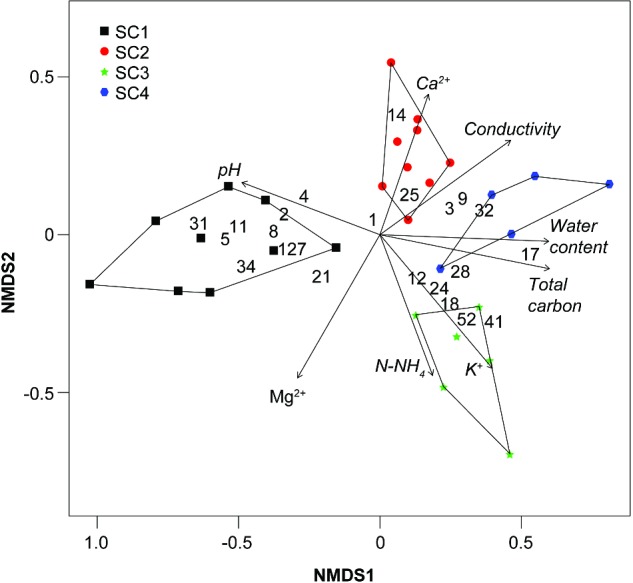
Non-metric multidimensional analysis. Numbers indicate OTUs with statistically different relative abundances across the four sites (Table 2).

Non-metric multidimensional analysis. Numbers indicate OTUs with statistically different relative abundances across the four sites (Table 2).