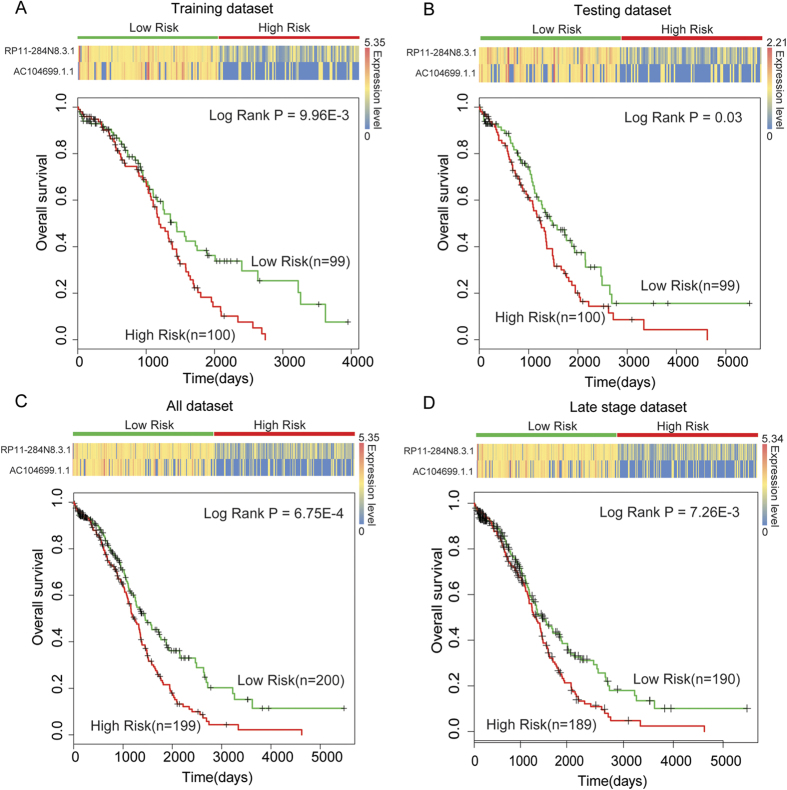
Figure 5. The integration of two lncRNAs predicts the clinical outcome of OV patients.
The expression profiles of the lncRNAs are shown in the top panel. A corresponding Kaplan-Meier survival plot (bottom) of the two patient subgroups. The ITLS was able to distinguish patients with different clinical outcomes in (A) the training dataset, (B) the testing dataset, (C) the combined dataset and (D) the late-stage dataset. Patients who showed no progression or who were still alive at the time of the last follow-up were censored (+). Survival days are shown along the x-axis. Overall survival rates are shown along the y-axis.

