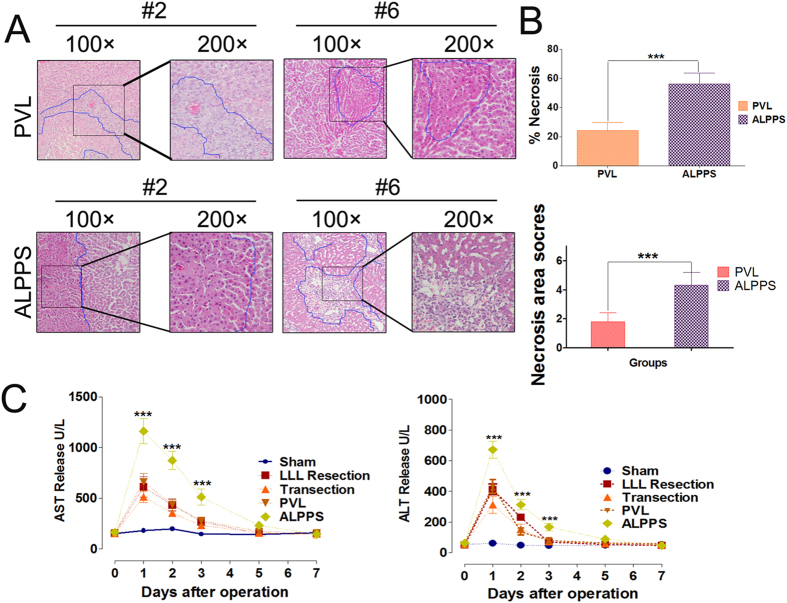
Figure 5. Quantification of hepatocellular injury after different surgical interventions.
(A) Represent H&E staining of perivascular necrosis in liver lobes after PVL or ALPPS at the 24 h time point (100× and 200×). (B) The necrosis areas pervisual field (100×) of the RML in ALPPS was significantly different compared with that in the PVL group at 24 h (*P < 0.001). Values are means ± SD. (C) AST and ALT release at all time points (after ALPPS Step I surgery) were measured. There was a significant difference in AST and ALT release between the ALPPS and the other groups on day 1, day 2 and day 3 (*P < 0.001). Values are means ± SD.

