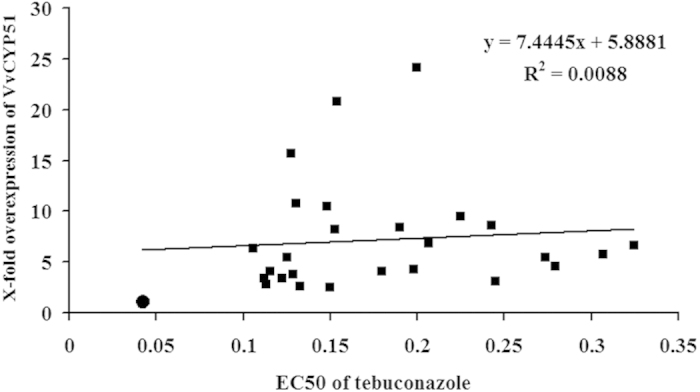
Figure 4. Relationships between relative expression of VvCYP51 and sensitivity (EC50 values) to tebuconazole in tranformants.

Linear regression analyses and coefficients of determination (R2) are shown no correlation. The circle denotes FJ4-1b and squares denote pBHt2-Vv51wt transformants.
