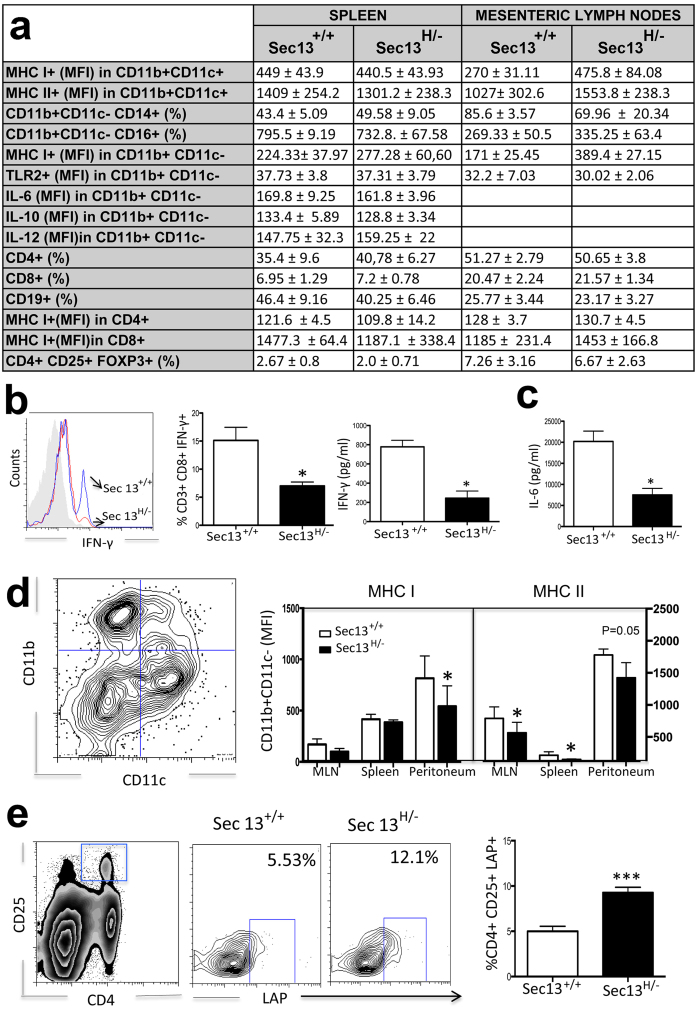
Figure 4. Sec13H/− Mice Present Specific Immunological Alterations.
(a) Analysis of immunological cell populations in Sec13+/+ and Sec13H/− mice. Cell subsets isolated from spleen and mesenteric lymph nodes (MLN) were analyzed by flow cytometry using CD4+ and CD8+ as phenotypic markers for T lymphocytes, CD19+ for B lymphocytes, and CD11b+CD11c- for macrophages. Results are the mean ± SD (n = 8). Intracellular cytokine production (IL-6, IL-10, and IL-12) was measured by flow cytometry in cultured cells in the presence of ConA and GolgiStop®. (b–e) Splenic cells from Sec13+/+ and Sec13H/− mice were subjected to flow cytometry to analyze frequencies of specific populations and expression of molecules. Cells were harvested and cultured for 48h in the presence of Con-A. Intracellular cytokine production was measured by flow cytometry in cultured cells in the presence of ConA and GolgiStop®. Cells were also stained with FITC-labeled anti-CD8, PercP-labeled anti-CD3 and PE-labeled anti-IFN-γ. Bar graphs are shown as mean ± SEM. (b,c) Cytokine production by splenic cells was measured in the supernatant by sandwich ELISA. Bar graphs are shown as mean ± SEM. (d) MHC I and MHC II expression was measured in CD11b+ CD11- cells isolated from mesenteric lymph nodes, spleen, and peritoneum. Graphs are representative of 6 mice/group. (e) Cells were stained with FITC-labeled anti-CD4, PercP-labeled anti-CD25, and PE-labeled anti-LAP. CD4+ cells and CD25+ were gated. LAP+ cells were gated within CD4+ CD25+ cells. Plots are representative of the mean of 3 mice/group. All data are representative of three independent experiments. Bar graphs are shown as mean ± SEM. Student T test was applied. *p < 0.05; ***p < 0.0005.

