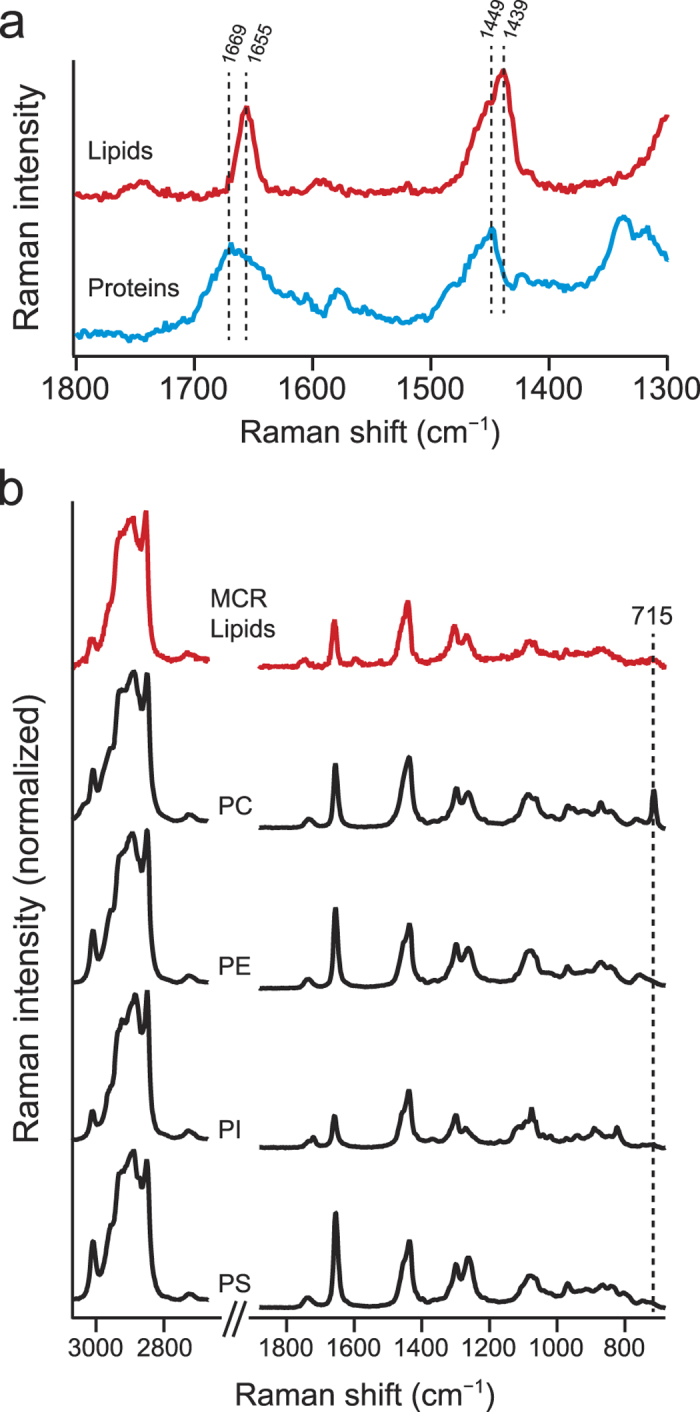
Figure 3. Detailed examination of MCR-derived lipid and protein Raman spectra.

(a) Raman spectra of the lipid (red line) and protein (blue line) MCR components in the 1300–1800 cm−1 region. (b) MCR-derived lipid spectrum and the Raman spectra of four model phospholipid compounds, namely, phosphatidylcholine (PC), phosphatidylethanolamine (PE), phosphatidylinositol (PI), and phosphatidylserine (PS). The Raman spectra of the model phospholipids were recorded with a 10-s exposure time and 3-mW laser power. The average of 10 spectra is presented for each compound.
