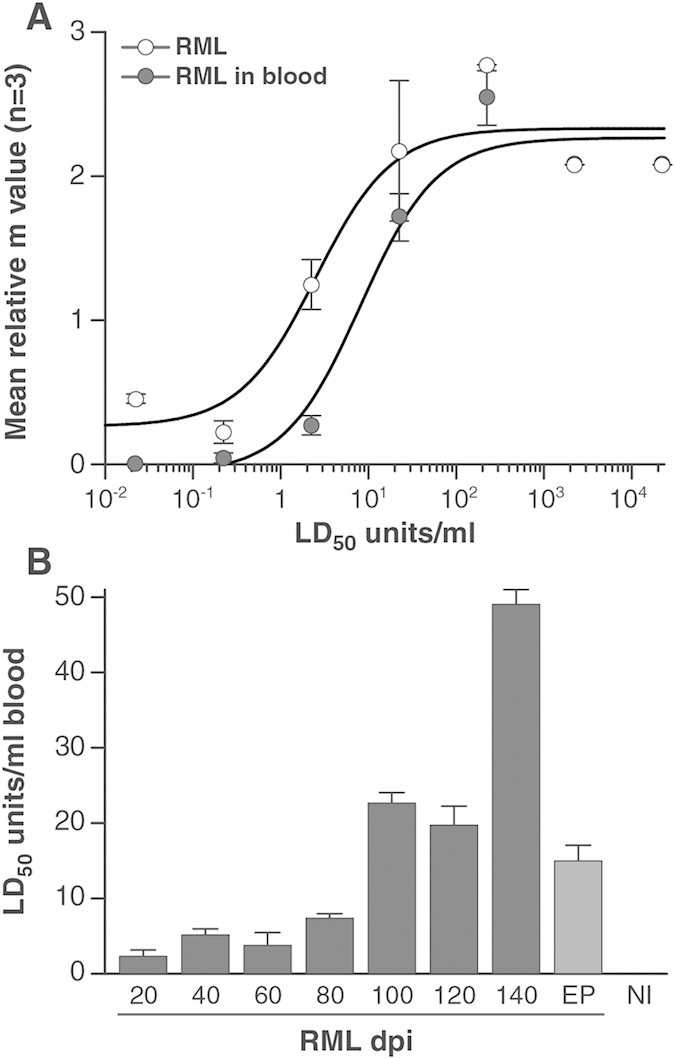
Figure 4. Detection of infectivity in blood prior to onset of clinical disease.

Detection and quantification of infectivity in samples taken at 20, 40, 60, 80, 100, 120, 140 days post infection (dpi) and clinical end-point (EP) from CD-1 mice infected with RML prions was achieved using SSBA. Panel (A) shows the correlation between m value (n = 3, mean +/− SD) and titred RML-infected brain homogenate when spiked into either OFCS/10−4 FVB/N-Prnp0/0 (open circles) or control rodent blood (closed circles). Panel (B) shows the calculated LD50 units/ml in whole blood taken from mice culled at each of the 20 day intervals post inoculation with RML prions. The m value obtained in the SSBA for each of the time point groups (n = 12, mean +/− SD) was converted to LD50 units/ml using the correlation between m value and LD50 units/ml for titred RML-infected brain homogenate spiked into control rodent blood as shown in panel (A). The data were fitted to the equation m = (B + ((M*L)/(K + L))), where K = a saturation constant (mid-point of the m value amplitude), B = background m value and M = m value amplitude or range and L = prion titre.
