
Figure 5. Assessment of blood-brain barrier integrity using MMP-9.
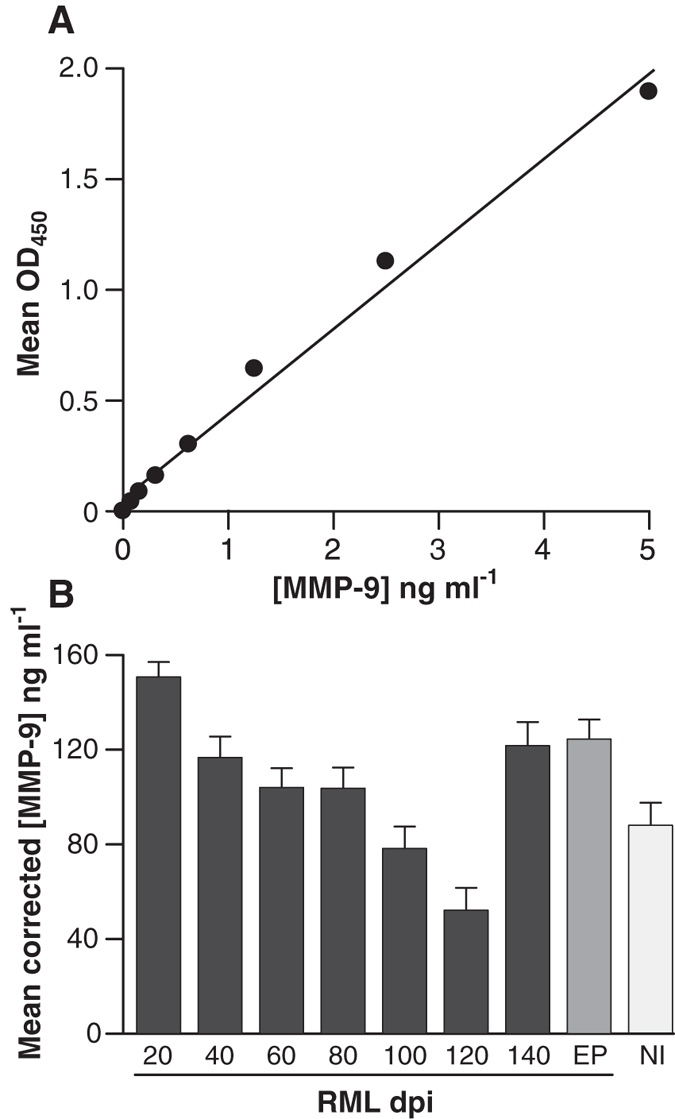
Panel (A) shows the correlation between the mean OD450 nm readings and the concentration of a standard dilution series of MMP-9 (ng ml−1). This data was used as a standard curve for converting OD450 nm readings to the concentration of MMP-9 in blood. The data in panel (B) display the corrected mean (n = 3, mean +/− SD) concentration of MMP-9 in ng ml−1 in pooled whole blood from CD-1 mice inoculated with RML-infected brain homogenate at 20 day intervals post inoculation (dpi) until clinical end point of disease (EP). Pooled blood from non-infected control CD-1 mice is represented as NI.