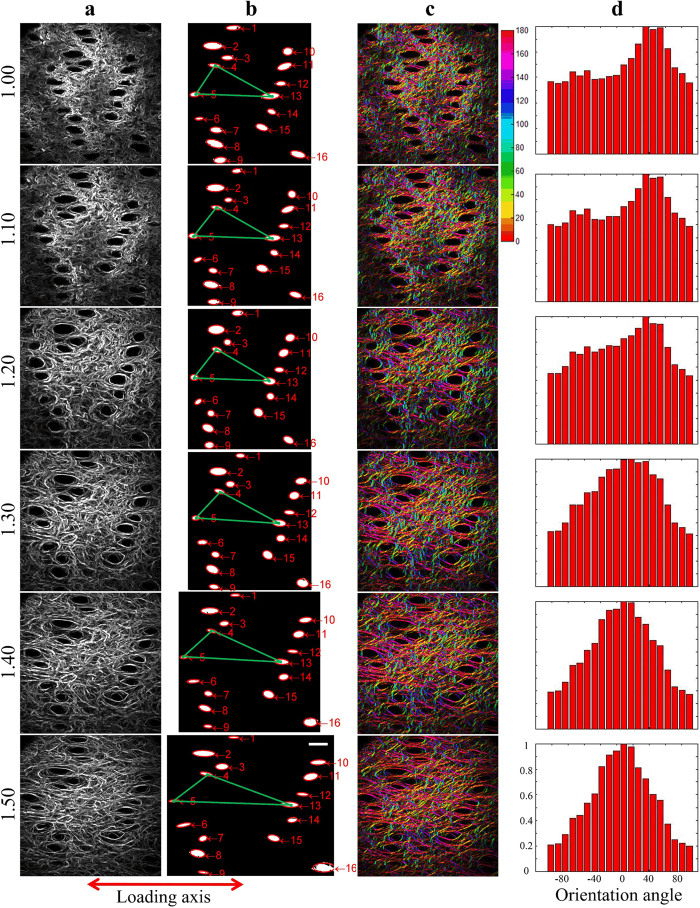
Figure 2. SHG imaging and processing of ex vivo stretched skin sample from K14-COL5A1 mouse.
(a) Raw SHG image of the dermis as a function of increased skin global deformation (top to bottom). Image size: 480 × 480 μm2. (b) Hair follicle segmentation revealing skin local deformation. Scale bar: 50 μm. (c) Processed SHG image (structuring element of 21 pixels) highlighting fiber orientations in every pixel with color code. Image size: 480 × 480 μm2. (d) Orientation histograms showing collagen increasing alignment along the traction direction.

