
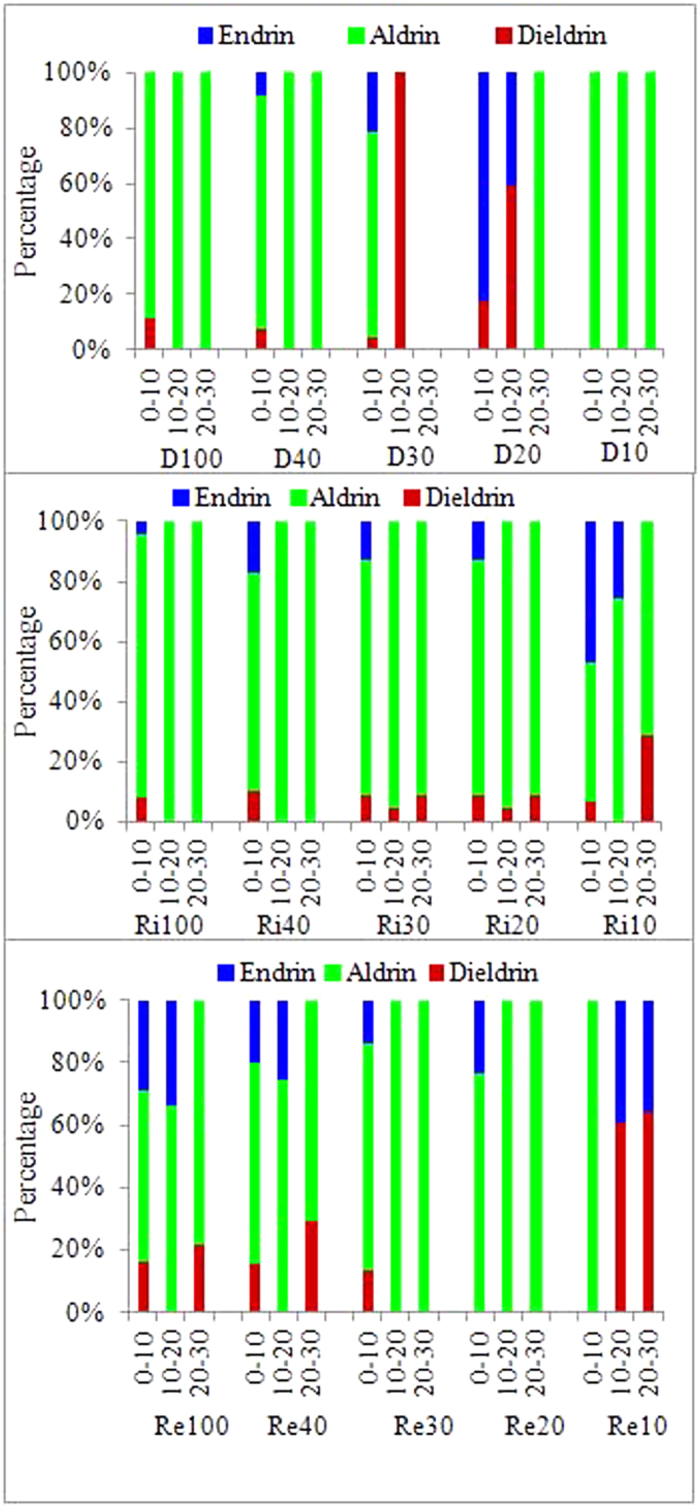
Figure 4. Profile distribution of the percentages of the composition of DRIN isomers in soils under different land uses along a 100-yr chronosequence of reclamation.
Official websites use .gov
A
.gov website belongs to an official
government organization in the United States.
Secure .gov websites use HTTPS
A lock (
) or https:// means you've safely
connected to the .gov website. Share sensitive
information only on official, secure websites.