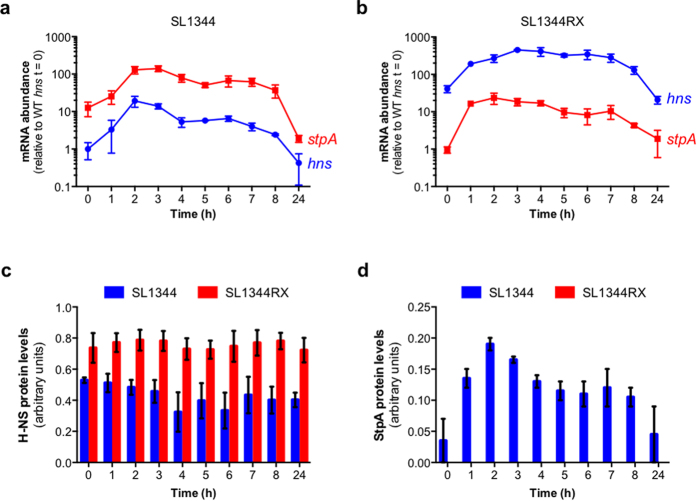
Figure 3. Expression of hns and stpA mRNA and protein in SL1344 and SL1344RX.
Transcripts encoded by the hns (blue) and stpA (red) open reading frames in SL1344 (wild type) (a) and SL1344RX (b) as a function of time were monitored by RT-qPCR. Transcript levels are expressed relative to the level of the hns mRNA transcript in wild type SL1344 at t = 0. H-NS (c) and StpA (d) protein levels in SL1344 (blue) and SL1344RX (red) were determined by Western blotting. Protein levels were measured by densitometry and expressed relative to an internal control in arbitrary units. The mean and standard deviation for mRNA and protein levels are plotted for three biological replicates (N = 3).

