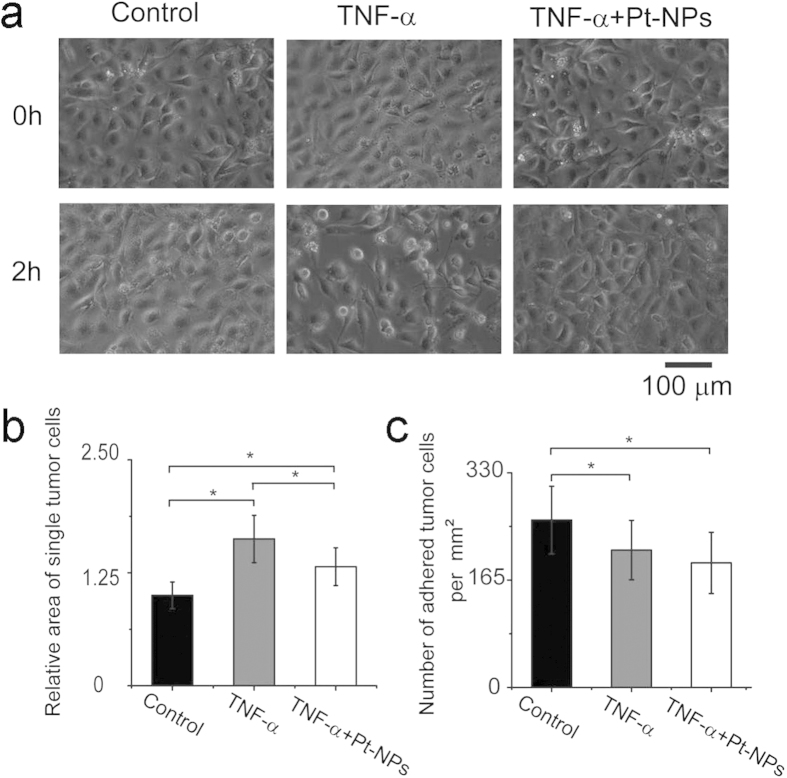
Figure 7. Pt-NPs treatment on the model.
(a) The morphological changes of the ECs monolayers under control conditions, treated with TNF-α, treated with TNF-α + Pt-NPs, respectively. (b) The areas of the tumor cells adhered on the ECs monolayer under three different conditions: control, treated with TNF-α, treated with TNF-α + Pt-NPs, respectively. (c) The number of adhered tumor cells on the ECs monolayer under three different conditions: control, treated with TNF-α, treated with TNF-α + Pt-NPs, respectively. *Conditions that are statistically different (P < 0.05). All results are shown plotted as mean ± SD with each group containing three experiments.

