
Figure 3.
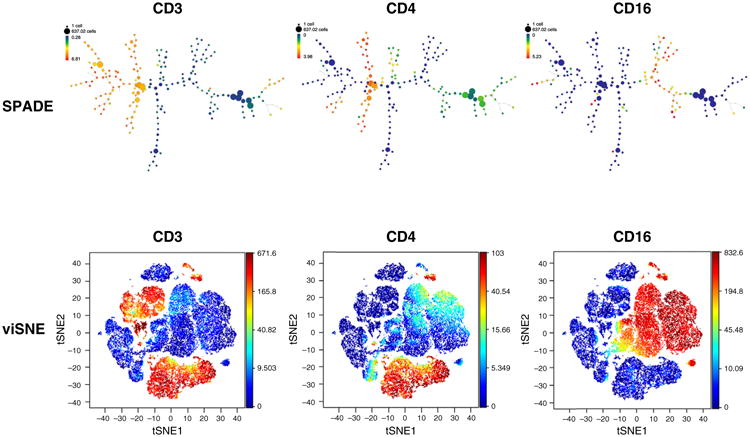
Representative antibody surface-staining results of fixed peripheral blood mononuclear cell (PBMC) analysis by SPADE and viSNE. Node size represents the number of cells and the color indicates expression of CD3 (cluster of differentiation 3), CD4 and CD16.