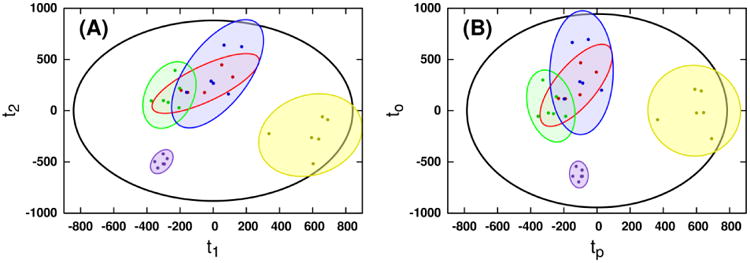
Figure 2.

Super scores identified by (A) MB-PLS and (B) MB-OPLS modeling of the joint 1H NMR and DI-ESI-MS data matrices. Extraction of y-orthogonal variation from the first PLS component is clear in the MB-OPLS scores. Ellipses represent the 95% confidence regions for each sub-class of observations, assuming normal distributions. Colors indicate membership to the untreated (yellow), 6-hydroxydopamine (red), 1-methyl-4-phenylpyridinium (green) and paraquat (violet) sub-classes. Cross-validated super scores for each model are shown in Supplementary Figure S-1. Block scores for each model are shown in Supplementary Figures S-2 and S-3.
