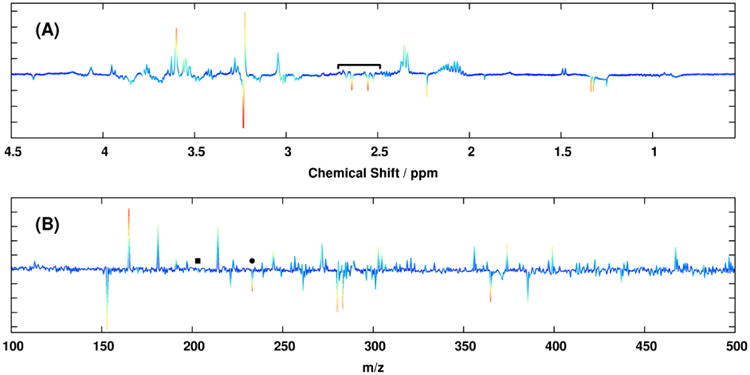
Figure 4.

Backscaled first-component block loadings from the MB-OPLS model of the (A) 1H NMR and (B) DI-ESI-MS data matrices. Coloring of each loading vector is identical to that of Figure 3. Spectral contributions from citrate in the 1H NMR MB-OPLS block loadings (2.6 ppm) are indicated by a bracket, and contributions from hexose and heptose in the DI-ESI-MS loadings are indicated by black squares and circles, respectively. Unlike the two-component MB-PLS model, the single predictive MB-OPLS component here fully separates observations between the classes under discrimination. Backscaled orthogonal block loadings from the same model are shown in Supplementary Figure S-4.
