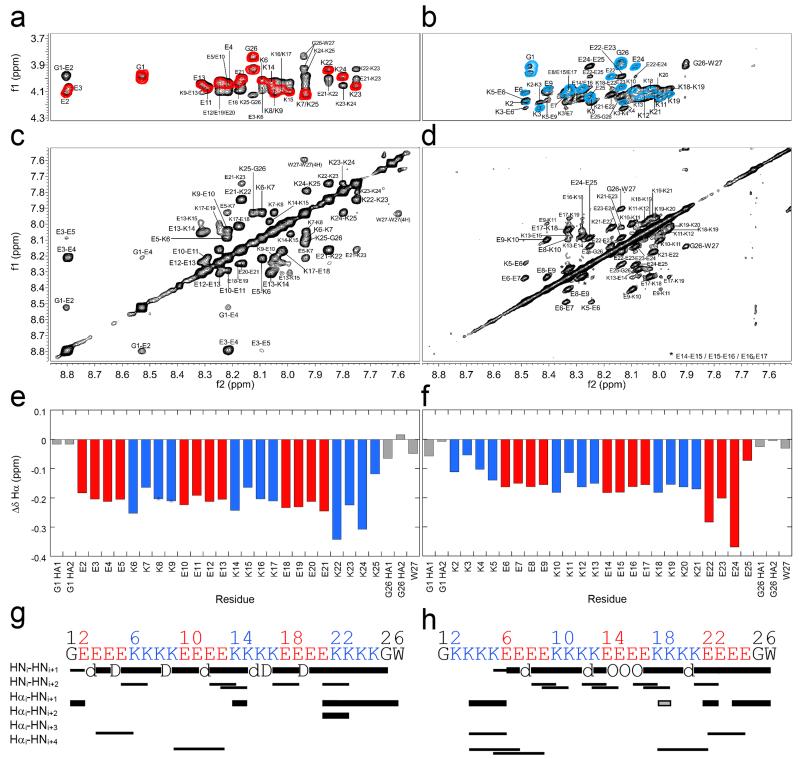
Figure 3. Locating α-helical structure by NMR spectroscopy.
1H-NMR spectra for (E4K4)3 (a&c) and (K4E4)3 (b&d). (a&b) Overlaid fingerprint regions of the TOCSY (coloured contours: red for (E4K4)3, and blue for (K4E4)3) and NOESY (black contours) spectra. Note the larger range of HN shifts for (E4K4)3. (b&d) NOESY spectra showing the amide regions and large number of sequential HNi-HNi+1 NOEs. Note the first NOE of this type for (K4E4)3 is between Lys-5 and Glu-6 (K5/E6 circled in d). (e&f) Δδ plots for the backbone Hα chemical shifts of (E4K4)3 and (K4E4)3, respectively. Key: Glu, red; Lys, blue; Gly and Trp, grey. Δδ values are the difference in sequence-corrected random coil chemical shifts from those observed. Δδs are greater for (E4K4)3 than (K4E4)3 on average, consistent with a more folded α-helix. (g&h) Connectivity diagrams for (E4K4)3 and (K4E4)3, respectively. Note there are only a few identifiable Hα-HN NOEs due to significant peak overlap in this region (a&b). Key: thick bars, medium intensity NOEs (1.8 – 3.5 Å); thin bars, weak NOEs (1.8 – 5.0 Å); grey, ambiguous; d, NOE hidden by diagonal; D, degenerate; O, overlapped. Conditions: 1 mM peptide concentration in PBS (137 mM NaCl) with 10% D2O, pH 7.4 at 5 °C; (E4K4)3 600 MHz, and (K4E4)3 900 MHz.

