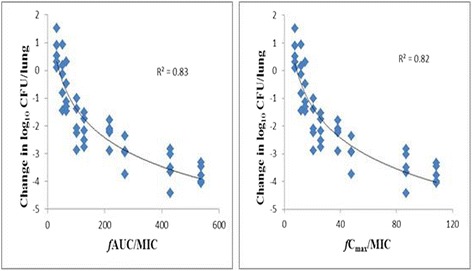
Fig. 2.

Relationships between marbofloxacin’s fAUC24/MIC, fCmax/MIC and microbiological efficacy for pasteurella multocida. The neutropenic mice were infected with P. multocida 10 h prior to the start of therapy. Groups of five mice were treated for 24 h with single marbofloxacin doses from 0.625 to 10 mg/kg/24 h (0.625, 1, 1.25, 2, 2.5, 4, 5, 8, 10 mg/kg). After 24 h of therapy, the amount of bacteria in the lungs was counted. The figure above reveals the relationships of marbofloxacin’s fAUC24/MIC and fCmax/MIC for pasteurella multocida CVCC 411 with the change in the log10 number of CFU/lung after 24 h of therapy. Each symbol represents a single lung tissue per mouse. R2 is the correlation coefficient
