
Fig. 2.
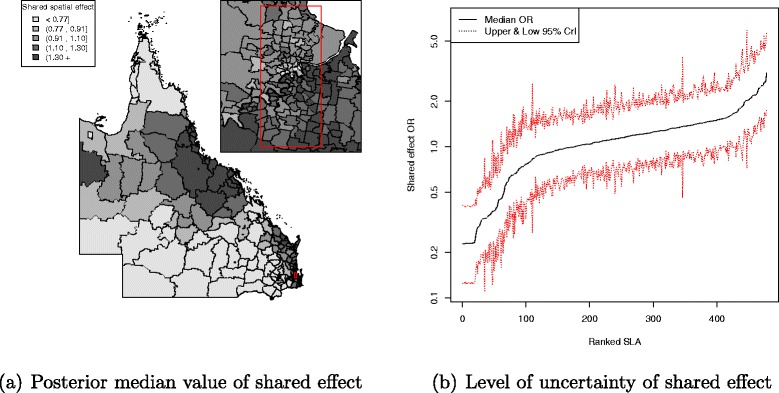
Posterior odds ratio for the shared component effect among adjuvant therapies at SLA level, 1997–2008. Estimated posterior odds ratio for the 478 SLA shared spatial effect to the intended adjuvant therapies among all study cohort across QLD. Map (a) with median value of the shared spatial effect separated into quintiles (<0.77, 0.91, 1.10, 1.30, 1.30 +) and a line plot (b) for the ranked SLA median shared spatial effect values with 95 % credible interval