
Fig. 5.
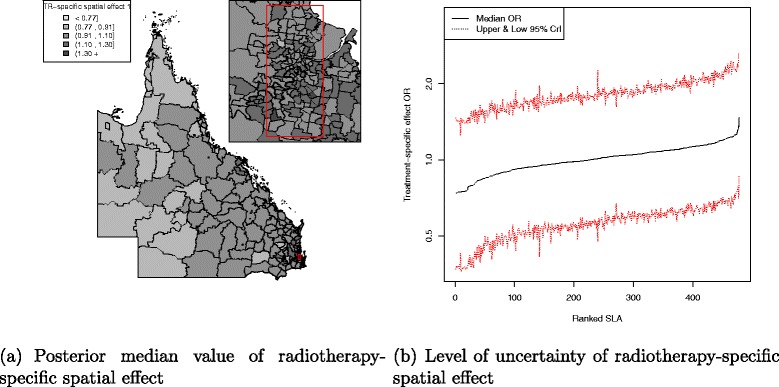
Posterior odds ratio for the radiotherapy-specific spatial effect at SLA level, 1997–2008. Estimated posterior odds ratio for the 478 SLA radiotherapy-specific spatial effect among all study cohort across QLD. Map (a) with median value of the radiotherapy-specific spatial effect separated into quintiles (<0.77, 0.91, 1.10, 1.30, 1.30 +) and a line plot (b) for the ranked SLA median radiotherapy-specific spatial effect values with 95 % credible interval