
Fig. 6.
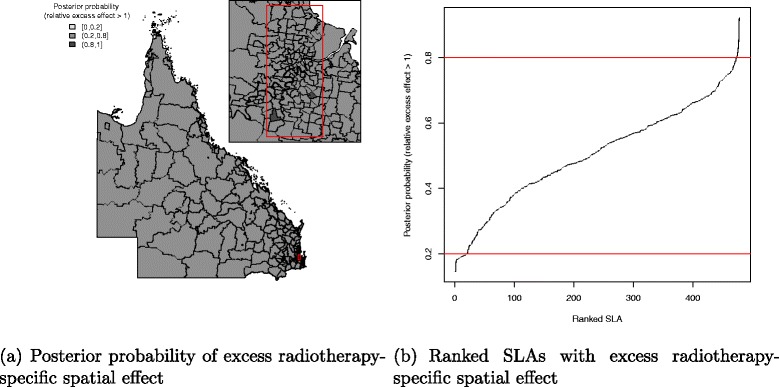
Posterior probability of excess radiotherapy-specific spatial effect at SLA level, 1997–2008. Map (a) posterior probability of excess radiotherapy-specific spatial effect (less than 0.2, 0.2–0.8 and greater than 0.8) and a line plot (b) approximate number of ranked SLAs with excess radiotherapy-specific spatial effect in QLD