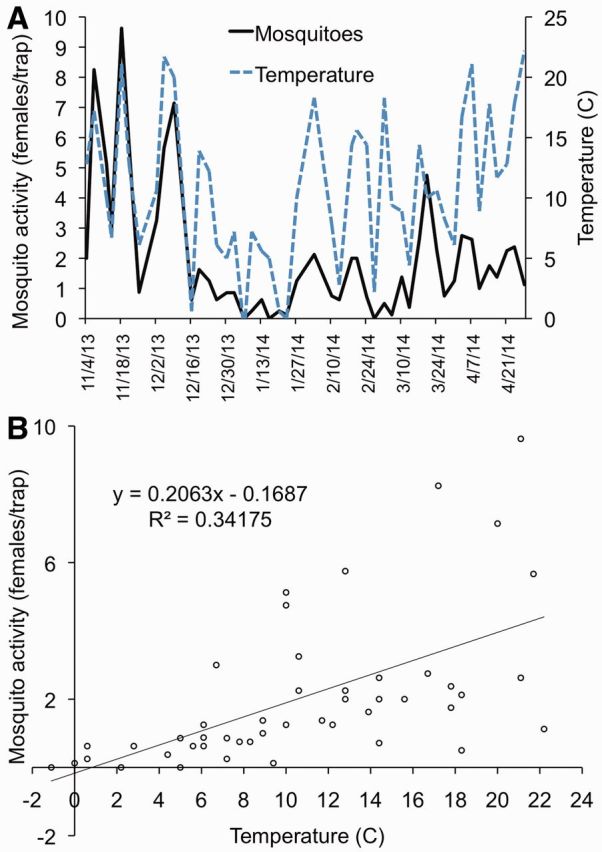
Fig. 3.

Mosquito and EEEV activity and winter temperature in Walton County, FL (2013-2014). Panel A: Average of total females (20 species) collected from resting shelters (solid line) and morning (0700 hours) temperature (dashed line). Subzero temperatures are not displayed. Panel B: Scatter plot and best-fit line of relationship between mosquito activity (average of total females from Panel A) and morning temperature (0700 hours) at reference site. Temperature data from National Climatic Data Center.
