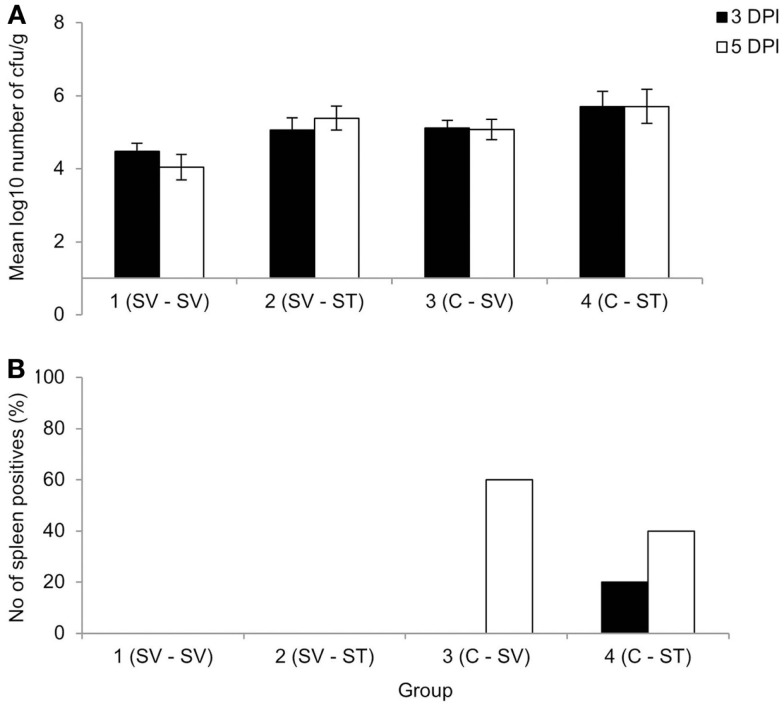
Figure 2.
Mean viable counts of bacteria in the cecal contents (A) and percentage of spleen positives following enrichment (B) at three and five DPI, following re-challenge after primary S. Virchow infection. Data shown are based on five birds per group at each time point. Group 1: primary infection with S. Virchow, secondary infection with S. Virchow; Group 2: primary infection with S. Virchow, secondary infection with S. Typhimurium; Group 3: primary infection with S. Virchow; and Group 4: primary infection with S. Typhimurium. Error bars represent the standard error of the mean.

