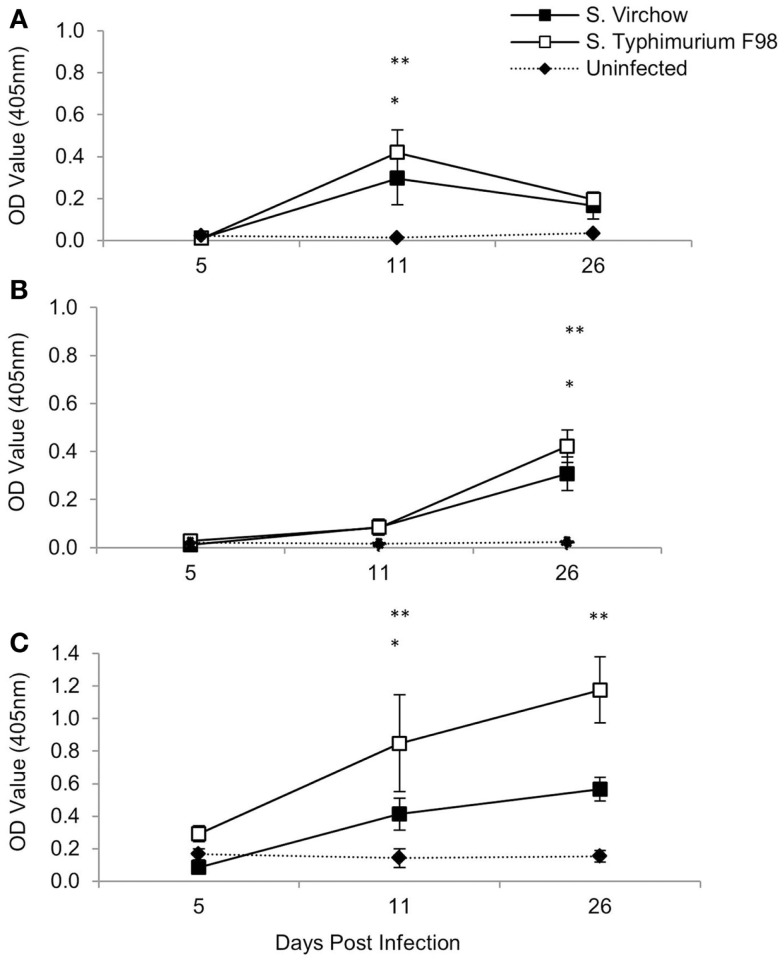
Figure 3.
Antigen-specific serum IgM (A), IgA (B), and IgG (C) against S. Virchow and S. Typhimurium at 5, 11, and 26 DPI, following infection of 7-day old chickens. Data shown are based on five birds per group at each time point. Error bars represent the standard error of the mean. An asterisk indicates that there was a significant difference between the S. Virchow infected group and uninfected group (*) or the S. Typhimurium infected group and the uninfected group (**) (P < 0.05).

