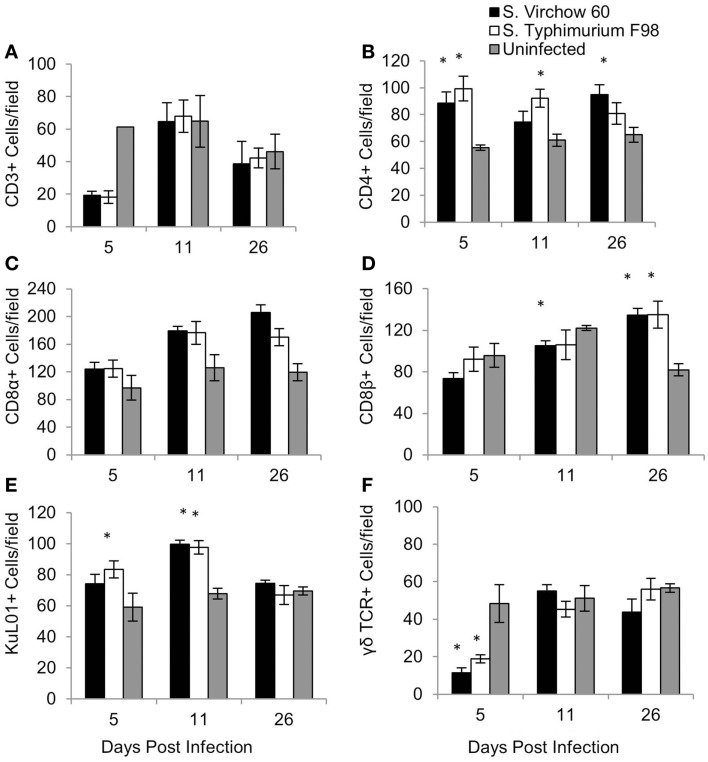
Figure 5.
Average number of CD3 (A), CD4 (B), CD8α (C), CD8β (D), KuL01 (E), and γδ TCR (F) positive cells/field in the spleen of chickens during S. Virchow and S. Typhimurium infection compared to in uninfected chickens. Data shown are based on minimum of five birds per group at each time point (n = 5 or 6) and five fields of view per bird. Error bars represent the standard error of the mean. The asterisk (*) indicates a significant difference between the infected group and uninfected group.

