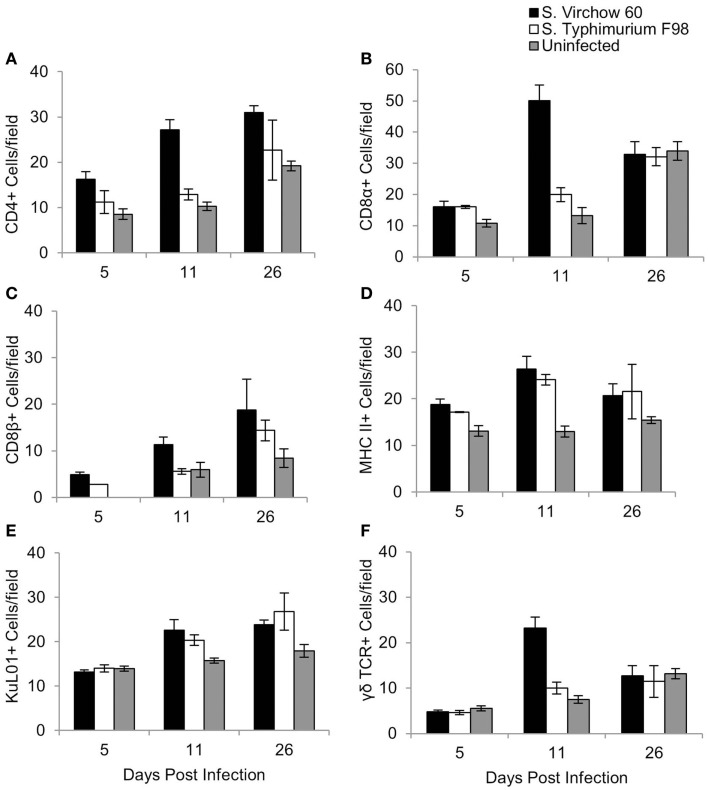
Figure 6.
Average number of CD4 (A), CD8α (B), CD8β (C), MHC II (D), KuL01 (E), and γδ TCR (F) positive cells/field in the ileum of chickens during S. Virchow and S. Typhimurium infection compared to in uninfected chickens. Data shown are based on minimum of 5 birds per group at each time point (n = 5 or 6) and 10 fields of view per bird. Error bars represent the standard error of the mean. The asterisk (*) indicates a significant difference between the infected group and uninfected group.

