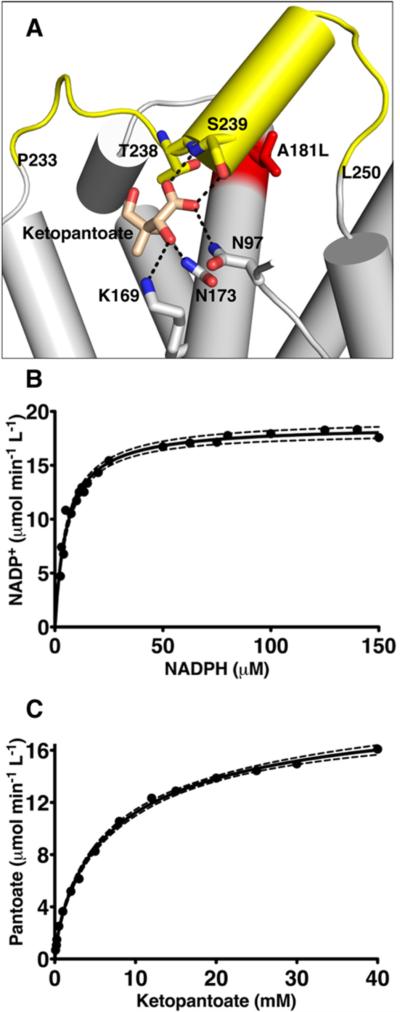
Figure 7.
Kinetics of the KPR A181L mutation. (A) Cartoon representation of the ketopantoate binding site. Residues interacting with the ketopantoate are depicted as sticks and labeled. The A181L mutation is colored red. In the A181L mutant, the segment from residue 233 to residue 250 becomes disordered (colored yellow), preventing the interaction of S239 with ketopantoate. (B) The substrate saturation curve of KPR A181L with respect to NADPH is hyberbolic. Dashed lines represent the 95% confidence interval. (C) Substrate saturation curve of KPR A181L with respect to ketopantoate showing negative cooperativity.

