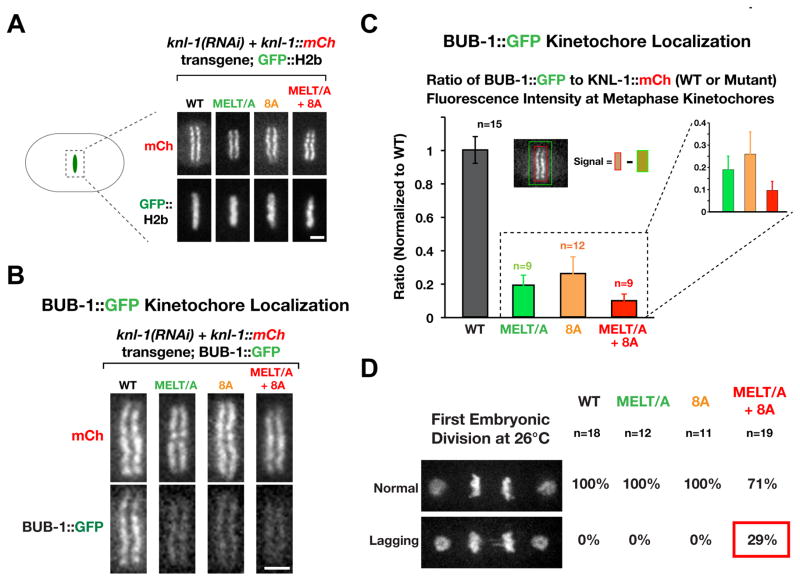
Figure 2. Mutations in KNL-1 that disrupt Plk1 phosphorylation perturb BUB-1 kinetochore recruitment and chromosome segregation.
(A) Images of the metaphase plate in one-cell embryos depleted of endogenous KNL-1 that express indicated RNAi-resistant KNL-1::mCherry variants and GFP::H2b. Scale bar, 2 μm.
(B) Analysis of BUB-1::GFP kinetochore targeting in the indicated KNL-1 variants. Endogenous KNL-1 was depleted in each condition. Scale bar, 2 μm.
(C) Quantification of BUB-1::GFP kinetochore localization in the indicated strains. Graph plots the ratio of BUB-1::GFP (green) to KNL-1::mCh (red) measured at kinetochores of aligned chromosomes. The measured ratios were normalized relative to WT KNL-1. n refers to the number of embryos analyzed. Error bars are the 95% confidence interval.
(D) Images represent normal segregation (top) or segregation with lagging chromatin (bottom) in one-cell embryos at 26°C. The frequency of each for the indicated KNL-1 variants is shown on the right. Scale bar, 5 μm.

