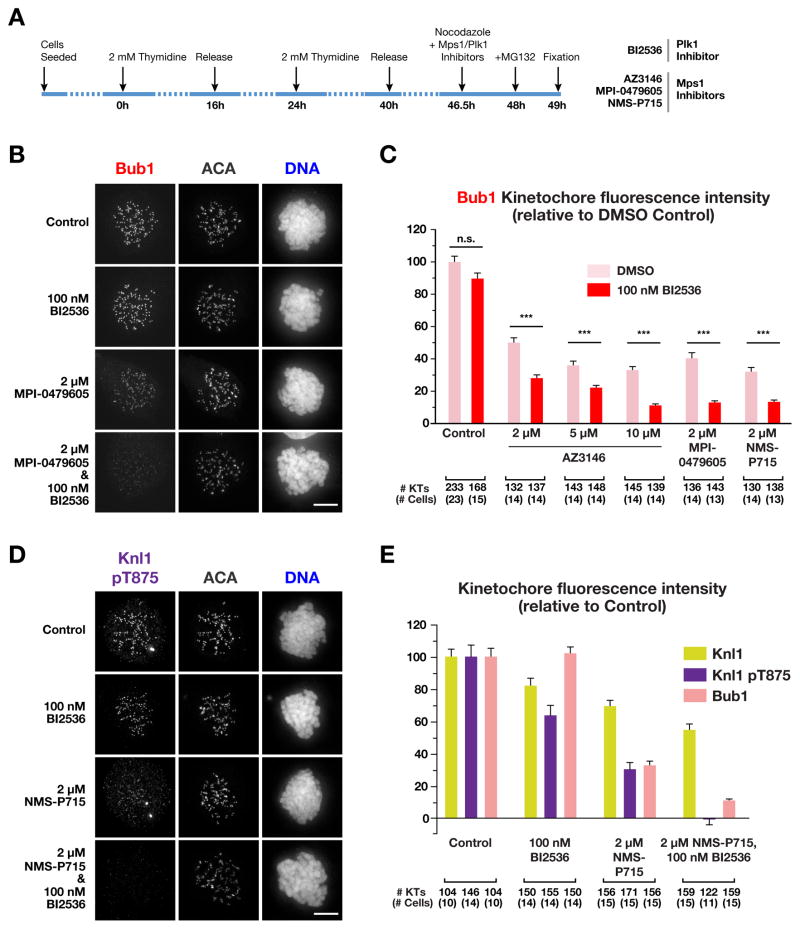
Figure 4. Effect of Plk1 inhibition on Knl1 phosphorylation and Bub1 localization in Mps1-inhibited human cells.
(A) Schematic of the protocol used to treat cells with inhibitors prior to mitotic entry under microtubule depolymerization conditions. HeLa cells were used for this analysis and, after fixation, stained for Bub1, Mad1 or Knl1, and centromeres (ACA).
(B) Representative immunofluorescence images of mitotic HeLa cells treated with the Plk1 inhibitor BI2536, the Mps1 inhibitor MPI-0479605, or both, and stained for Bub1. Scale bar, 5 μm.
(C) Quantification of Bub1 kinetochore intensities for the indicated conditions. Values are normalized to controls. Error bars represent the 95% confidence interval for all kinetochores measured. ***: p < 0.0001
(D) Representative immunofluorescence images of mitotic HeLa cells stained for Knl1 pT875 under the indicated conditions. Scale bar, 5 μm.
(E) Quantification of Knl1, Knl1 pT875 and Bub1 kinetochore intensities for the indicated conditions. Values are normalized to controls. Error bars represent the 95% confidence interval for all kinetochores measured. See also Figure S3 and S4.

