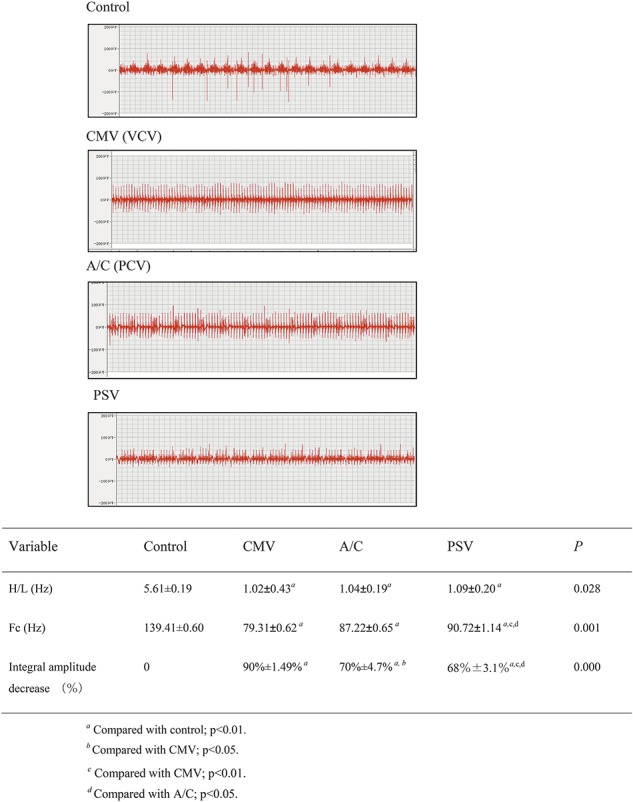
FIGURE 1.

Frequency and integral amplitude of Edi Fc: Centroid frequency: ratio of high frequency to low frequency. Values are mean ± SD. Fc and H/L were 139.41 ± 0.60 Hz and 5.61 ± 0.19 in Control, 79.31 ± 0.62 Hz and 1.02 ± 0.43 in CMV, 87.22 ± 0.65 Hz and 1.04 ± 0.19 in A/C, 90.72 ± 1.14 Hz and 1.09 ± 0.20 in PSV. The percentage in Fc was significantly lower in the PSV group (decreased by 34.9%), compared to the CMV (decreased by 43%) and A/C groups (decreased by 37.1%) p = 0.001, p = 0.028 respectively. Compared with Control group, CMV, A/C, and PSV H/L decreased by 82.3%, 81.8%, and 80.6%, respectively. Electromyography of diaphragm integral amplitude decreased 90% ± 1.48%, 70.2% ± 4.72% in A/C and 67.8% ± 3.13% in PSV (p < 0.01).
