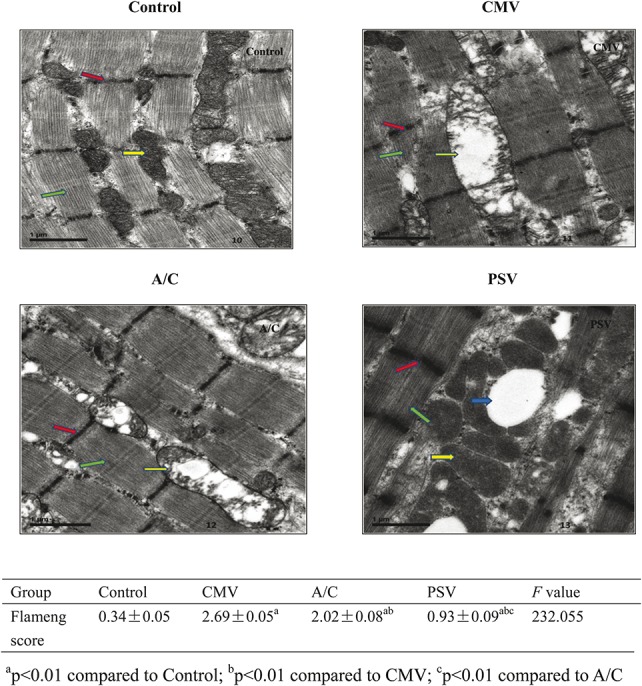
FIGURE 4.

Diaphragm ultra-structure injury through electron microscopy. Green arrows indicate muscle fiber, the red arrow indicates the Z line, the yellow arrow indicates the mitochondria and the blue arrow indicates the vacuoles. In the CMV group, there was myofibrillar mitochondrial swelling and low density of cell matrix; and crest deformation and dissolution. Some mitochondria were flocculent; there was myeloid and vacuolar degeneration; some parts of myofibrils were dissolved and cracked; with a loose arrangement and irregular myofilament cracks. The Z lines were generally neat but some had a blurred appearance along with structural disorder. In the A/C group, there was mitochondrial swelling and cristae deformation and dissolution; the myofibrils were arranged in neat rows with some loosely arranged; part of the Z lines were fuzzy and there was structural disorder and some myofibril vacuolization. In contrast to the CMV group, which had myofibrillar mitochondrial swelling and crest deformation and dissolution (see yellow arrow), the PSV group, had mitochondrial swelling, but the cristae were dense and rich (see yellow arrow); the muscle myofibrils were neatly arranged, sarcomere integrity was maintained (green arrow), the Z lines neat and clear (red arrow); and there was formation of a large number of vacuoles and lipid vacuoles among the muscle fibers (blue arrow) (Bar = 1 μm). The Flameng scores in PSV were significantly lower compared with the CMV and A/C modes (P < 0.01).
