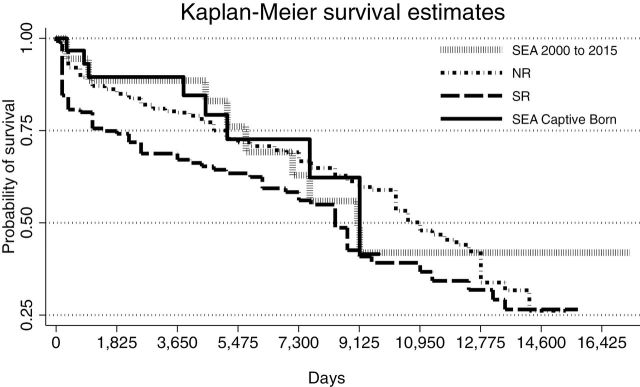
Fig. 5.—
Kaplan–Meier survival curves for the proportion of killer whales (Orcinus orca) alive over time (days) for northern resident 1975–2014 (NR, n = 363), southern resident 1975–2015 (SR, n = 146), SEA (2000–2015, n = 39), and captive-born at SeaWorld Parks (SEA captive-born, 1985–2015, n = 31) killer whales. Significant differences (χ2 = 7.3, P = 0.007) were only detected between SR and NR populations.

