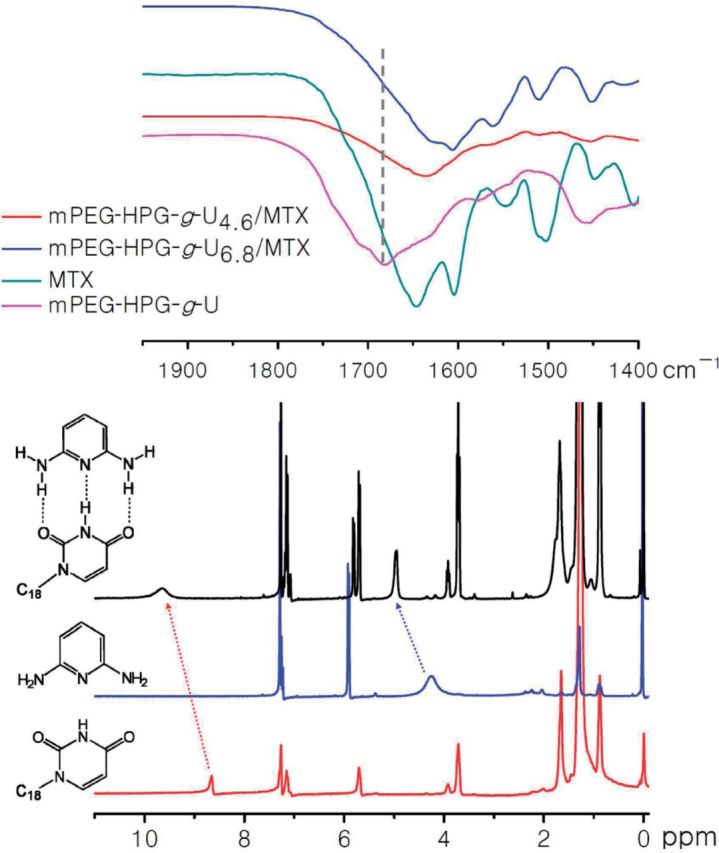
Figure 5.

IR spectra of MTX, mPEG-HPG-g-U and MTX-loaded NPs (upper) and 1H NMR spectra in CDCl3 of DPA (red), U-C18 (black) and the mixture of DPA and U-C18 (below).

IR spectra of MTX, mPEG-HPG-g-U and MTX-loaded NPs (upper) and 1H NMR spectra in CDCl3 of DPA (red), U-C18 (black) and the mixture of DPA and U-C18 (below).