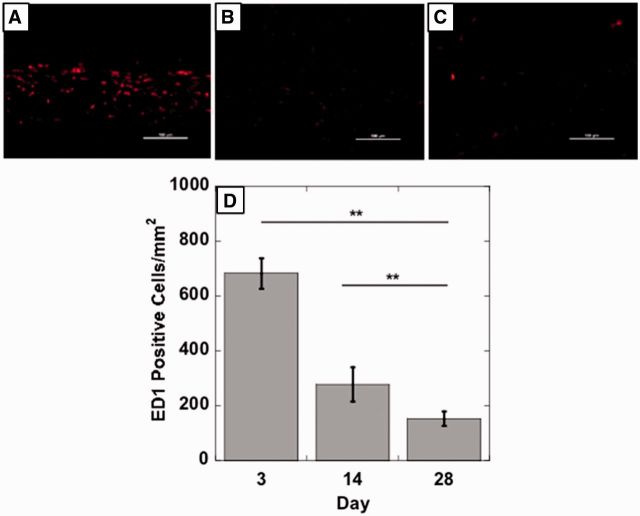
Figure 10.
Representative photomicrographs (200×, scale bar = 100 μm) of injection sites immunohistochemically stained with ED1, an antibody against the monocyte/macrophage marker CD68. Tissues were harvested on (A) Day 3, (B) Day 14 and (C) Day 28 post-injection. (D) The number of ED1-positive cells decreased with time, indicating a reduction in the inflammatory response. Images from 5 random areas around the injection sites were used for quantification at each time point. Data are shown as mean ± SD (n > 5). **P < 0.001.

