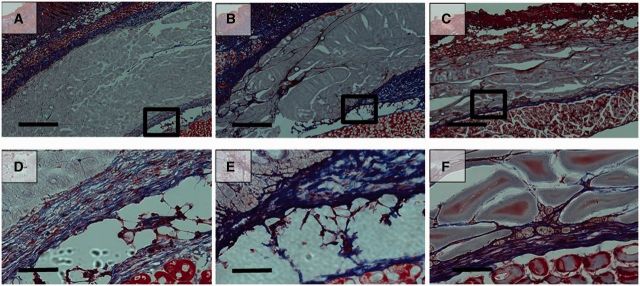
Figure 9.
MTS histological sections of the tissue adjacent to the sites of subcutaneous injection of 100 μl of 20% (wt/v) EPSHU into BALB/cJ mice. MTS confirmed that collagen deposition around the polymer (blue fibers, color images are available in downloadable pdf online.) was minimal at Day 3 (A and D), Day 14 (B and E) and Day 28 (C and F). (A–C) Low magnification of images (40×, scale bar = 500 μm). The rectangular frames indicate the fields chosen for capture at higher magnifications (D–F, 200×, scale bar = 100 μm).

