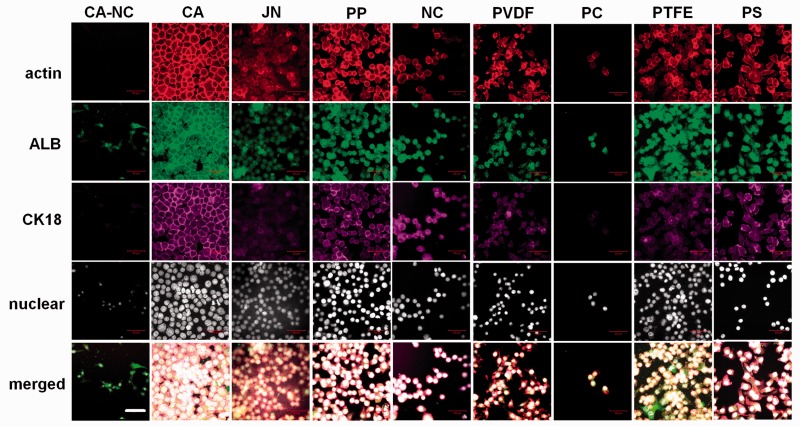
Figure 3.
hepatic biomarker expression of HepG2 cells grown on the eight membranes or PS substrate. Data were presented as the fluorescent staining of actin (first row), ALB (second row) or CK18 (third row) proteins and of nucleus presentation (fourth row) or merged co-localization (fifth row) at t = 24 h at × 63 (Bar = 50 µm).

