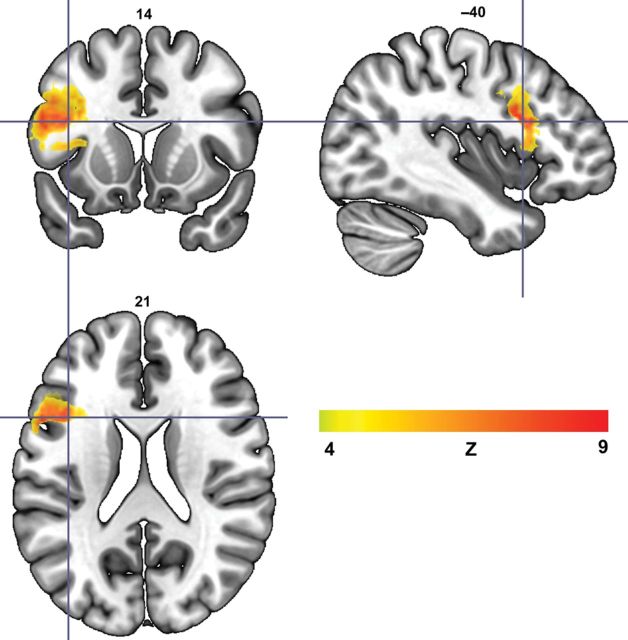
Figure 2.
VLSM analysis that compared brain damage in individuals with Broca's aphasia (N = 20) with individuals with other types of aphasia (N = 50). The lesion cluster that predicts Broca's aphasia is mostly confined within the posterior portion of Broca's area, the pars opercularis. The color bar represents Z-scores in the voxels that comprise the statistically significant cluster and the crosshairs denote the voxel with the highest Z-score.

