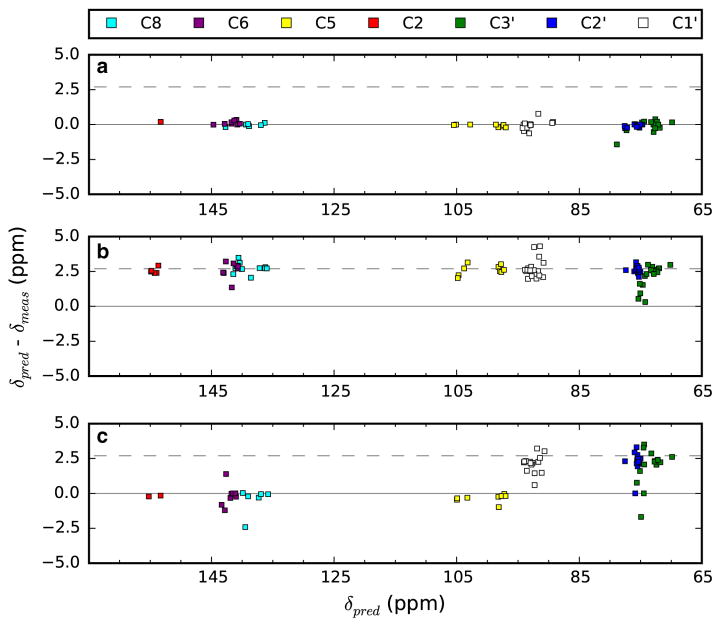
Fig. 3.
Plots of the deviation between measured and predicted values (δpred – δmeas) for three different BMRB entries. The plots are from calculations done without using our offset correction and trimming protocols, so represent fits to the raw chemical shift data. Data is taken from prediction runs using all BMRB entries, not just those illustrated. a BMRB entry 5705, b BMRB entry 18,975, c BMRB entry 5932. The dashed line corresponds to the common error of 2.7 ppm (Aeschbacher et al. 2012)

