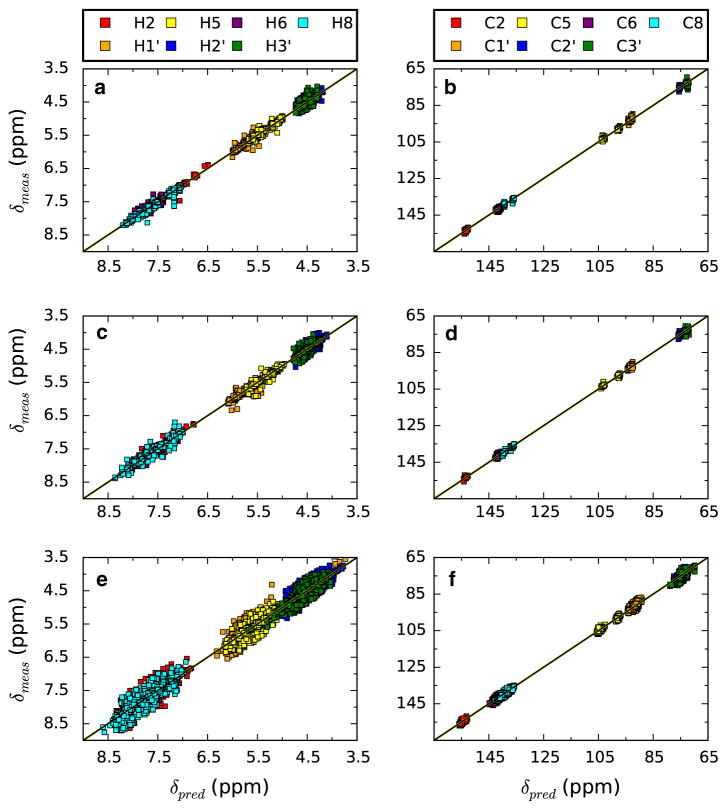
Fig. 5.
Plots of predicted versus measured values for the complete set of atoms obtained with the automated procedure described here. a, c and e are hydrogen shifts, and b, d and f are carbon shifts. a and b are canonical shifts in helices, c and d are non-canonical shifts in helices, and e and f are other shifts (see Table 1)

