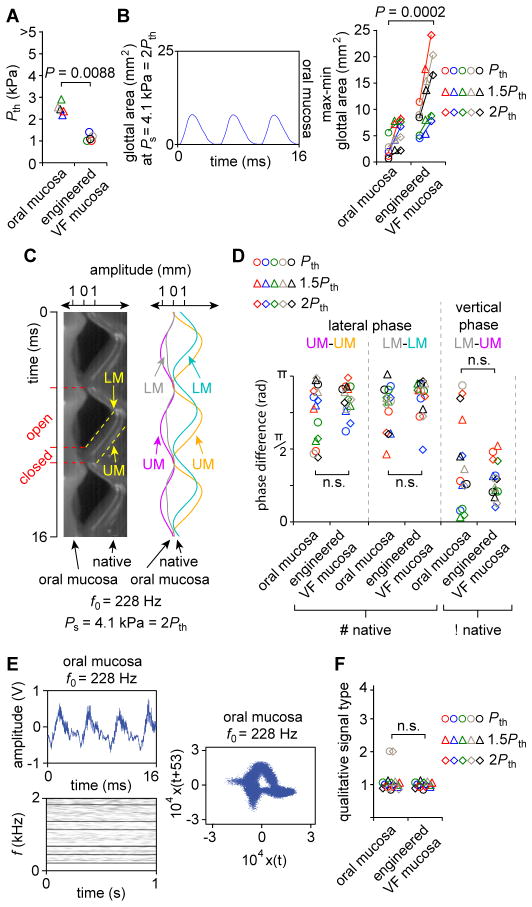
Fig. 5. Ex vivo physiologic performance of human oral mucosa, compared to that of engineered VF mucosa, in a canine excised larynx.
(A) Phonation threshold pressure (Pth). P values were calculated using a Student’s t test. (B) HSDI-based glottal area analysis. Ps, subglottal pressure. P values were calculated using ANOVA. (C) Representative kymogram from the larynx presented in (B). Red tick marks and dashed lines indicate open and closed phases of a single vibratory cycle. Yellow dashed lines indicate the upper and lower VF margins (UM and LM). Sinusoidal curve fitting (R2 > 0.98) to the UM and LM is also shown. f0, fundamental frequency. (D) Lateral and vertical phase differences for all larynges and conditions. #, contralateral VF mucosa condition used to calculate lateral phase difference; !, VF mucosa condition contralateral to that for which vertical phase difference is calculated. P values were calculated using ANOVA. (E) Representative acoustic data showing a time-domain signal (upper), narrowband spectrogram (lower) and phase plot (right). (F) Qualitative acoustic signal typing. The P value was calculated using a χ2 test. The engineered VF mucosa dataset used for statistical comparisons is presented in complete form in Fig. 4. Data from the same larynx (n = 5) are plotted in the same color (A, B, D, F); n.s., not significant.

