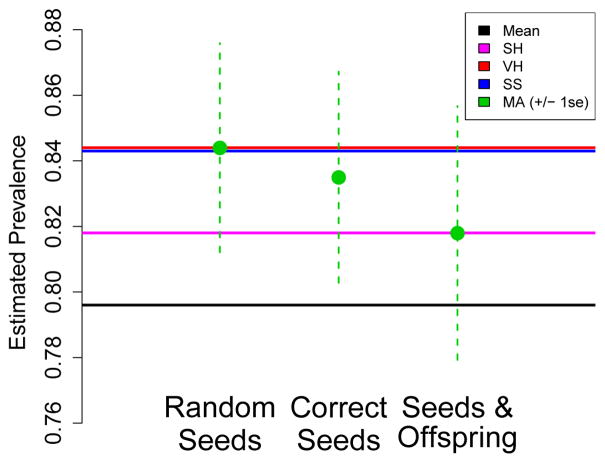
Fig. 3.
HIV prevalence estimates for injecting drug users in Mykolaiv, Ukraine, 2007. Three versions of μ̂MA are considered, represented by the points with vertical error bars. Four estimators μ̂SH, μ̂VH, μ̂SS, and the sample mean, are represented as horizontal lines for ease of comparison with all three values of μ̂MA.

