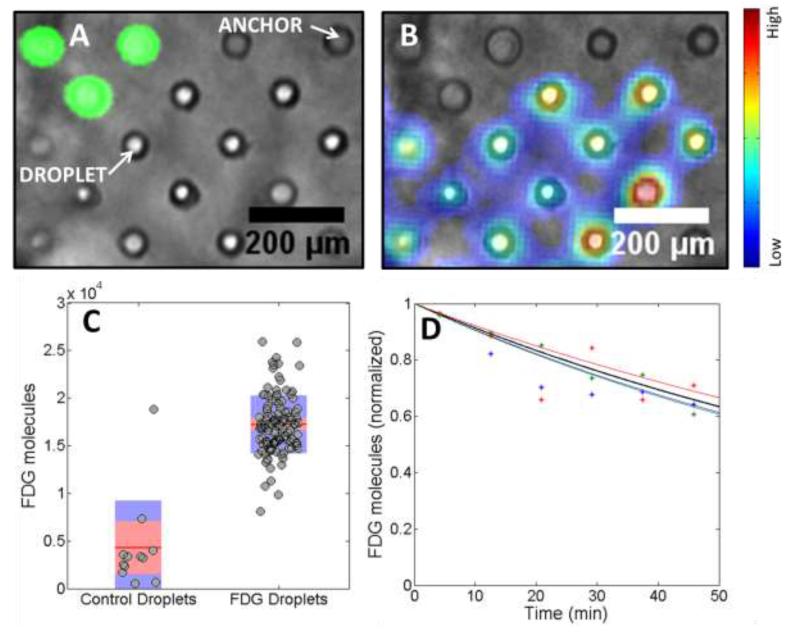
Figure 2.
Comparison of droplets containing a green fluorophore and a radioactive glucose analog, FDG. a) Fluorescence image of a subsection of the droplet array superimposed on a bright-field image. The green droplets contain fluorescein while clear droplets contain FDG b) Radioluminescence image superimposed on a bright-field image. Heat map intensity ranges from blue for low counts to red for high radiolabel count. c) Analysis of the number of observed FDG molecules for single droplets of control and FDG droplets. The average value is indicated by a red line. The standard deviation and the 95% confidence interval are indicated by a blue and red bar, respectively. d) Detected decays over time. The theoretical decay curve of 18F is shown in black. Data for three single droplets are shown in red, blue and green along with their fitted decay curves (solid lines).

