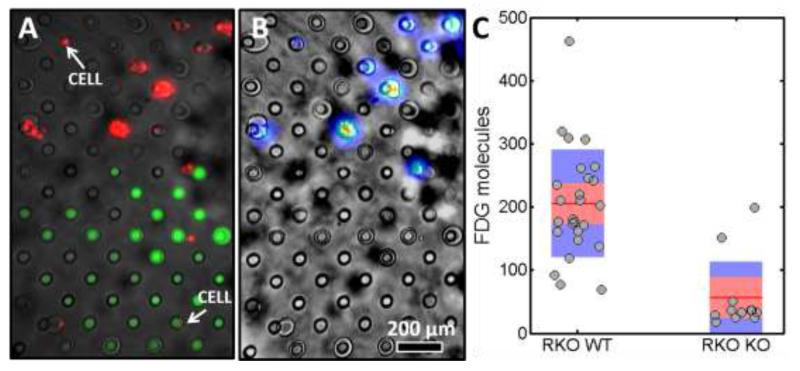
Figure 4.
Analysis of a colon cancer cells with wild-type (RKO WT) and glucose transporter 1 knockout (RKO KO). a) Fluorescence image of a subsection of the droplet array superimposed on a bright-field image. The clear droplets contain control cells while green droplets contain cells with the knockout. Individual cells are marked in red. b) Radioluminescence image superimposed on a bright-field image. Intensity ranges from blue for low counts to red for high counts of radiolabels and primarily coincides with the position of WT cells. c) Analysis of the number of observed FDG molecules for single cells for the control and knockout. The average value is indicated by a red line. The standard deviation and the 95% confidence interval are indicated by a blue and red bar, respectively.

