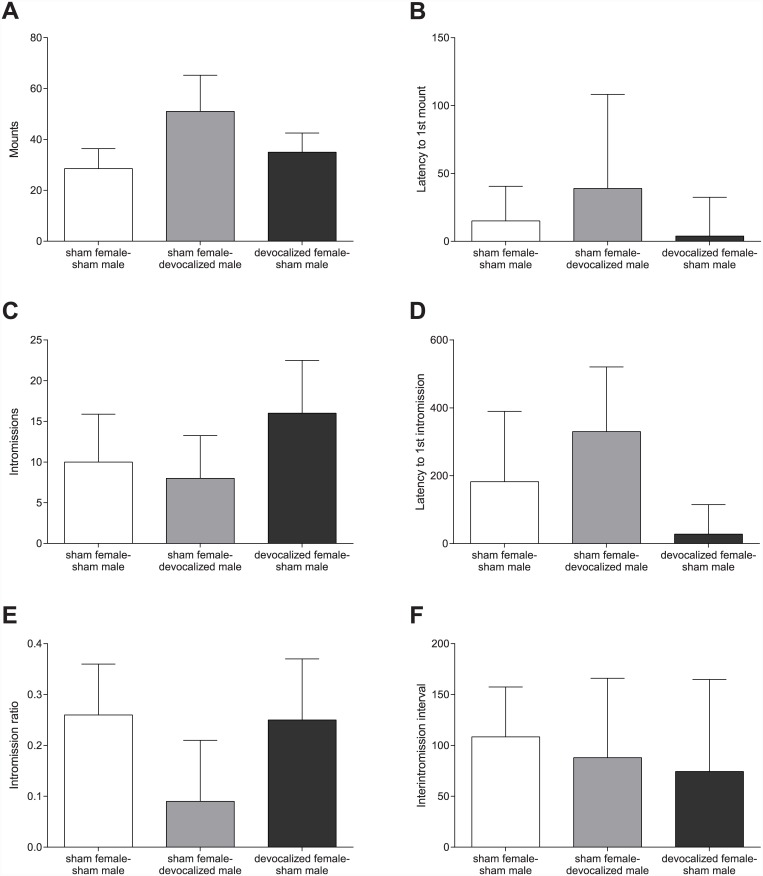
Fig 2. No differences in male copulatory behavior.
(A) The number of mounts, (B) the latency to the first mount, (C) the number of intromissions, (D) the latency to the first intromission, (E) the intromission ratio, and (F) the interintromission interval performed by the males. All graphs show the comparison between sham females paired with sham males, sham females paired with devocalized males and devocalized females paired with sham males. Data are shown as median ± semi interquartile range.

