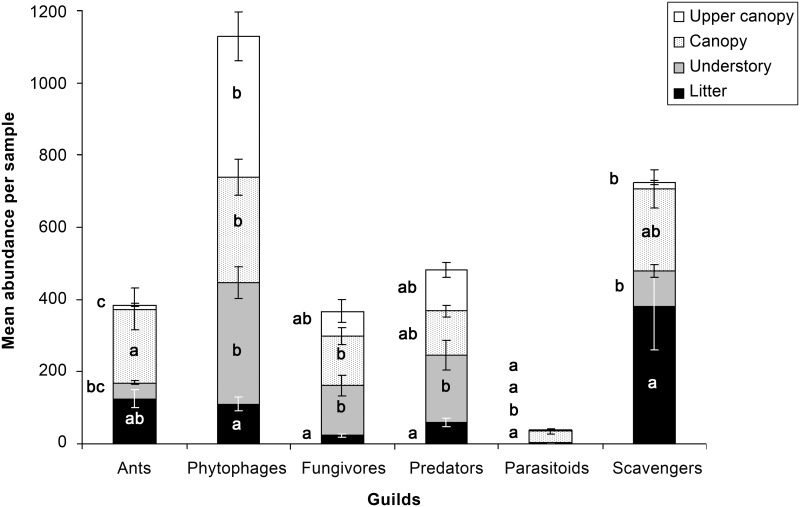
Fig 3. Mean (± s.e.) abundance per sample, detailed per arthropod guild and habitats (black bars = litter, grey bars = understory, stippled bars = canopy, white bars = upper canopy).
ANOVAs comparing mean abundance per habitat within guilds are all significant with at least p<0.01. For each guild, different letters denote significantly different means (Tukey tests, p<0.05).

